9. Uncertainty analysis#
Here we will demonstrate a full uncertainty analysis of the inversion. We use a stochastic approach, where we 1) choose the important input parameters to the inversion, 2) define each of there uncertainty distributions, 3) run a series of inversions which sample these inputs from their uncertainty distributions, and 4) use the ensemble of inverted topography models to define the mean result and the uncertainty.
9.1. Import packages#
[1]:
from __future__ import annotations

%load_ext autoreload
%autoreload 2
import copy
import logging
import pathlib
import pickle
import string

import matplotlib.pyplot as plt
import numpy as np
import scipy as sp
import verde as vd
import xarray as xr
from polartoolkit import maps, profiles
from polartoolkit import utils as polar_utils

from invert4geom import (
    plotting,
    regional,
    uncertainty,
    utils,
)

# set up logging to see what's going on
logging.basicConfig(level=logging.INFO)
10. Load results from notebook Combining it all#
[2]:
# load pickle files
params = []
with pathlib.Path("../tmp/combining_it_all_results.pickle").open("rb") as file:
    while True:
        try:
            params.append(pickle.load(file))
        except EOFError:
            break
(
    grav_df,
    constraint_points,
    starting_topography_kwargs,
    grids,
    inversion_results,
    kwargs,
    regional_grav_kwargs,
    _,
) = params
[3]:
grav_grid = grav_df.set_index(["northing", "easting"]).to_xarray()
grav_df.describe()
[3]:
| northing | easting | upward | upper_surface_grav | lower_surface_grav | observed_grav | gravity_anomaly | uncert | starting_gravity | true_res | misfit | reg | res | |
|---|---|---|---|---|---|---|---|---|---|---|---|---|---|
| count | 4941.000000 | 4941.000000 | 4941.0 | 4941.000000 | 4941.000000 | 4941.000000 | 4941.000000 | 4.941000e+03 | 4941.000000 | 4941.000000 | 4941.000000 | 4941.000000 | 4941.000000 |
| mean | 15000.000000 | 20000.000000 | 1001.0 | -0.229678 | 0.004286 | -0.225392 | -0.225332 | 1.000000e-01 | 1.025253 | -1.254871 | -1.250585 | -0.826228 | -0.424357 |
| std | 8804.299419 | 11691.635129 | 0.0 | 7.103507 | 0.720692 | 7.247722 | 7.245591 | 1.064189e-10 | 6.860052 | 4.621594 | 4.852437 | 1.372797 | 4.483062 |
| min | 0.000000 | 0.000000 | 1001.0 | -17.227928 | -1.034071 | -16.940400 | -17.040892 | 1.000000e-01 | -8.040797 | -19.592049 | -19.972713 | -3.252846 | -18.401579 |
| 25% | 7500.000000 | 10000.000000 | 1001.0 | -5.587227 | -0.610336 | -5.906763 | -5.910496 | 1.000000e-01 | -4.472542 | -3.008015 | -3.123793 | -2.048561 | -2.141997 |
| 50% | 15000.000000 | 20000.000000 | 1001.0 | -1.239580 | -0.155380 | -0.822890 | -0.813296 | 1.000000e-01 | -0.749905 | -1.483188 | -1.843795 | -0.733214 | -0.346209 |
| 75% | 22500.000000 | 30000.000000 | 1001.0 | 3.490030 | 0.542849 | 3.738912 | 3.726649 | 1.000000e-01 | 5.319529 | 0.577570 | 0.952694 | 0.418425 | 1.567813 |
| max | 30000.000000 | 40000.000000 | 1001.0 | 19.754954 | 1.602413 | 19.932831 | 19.959187 | 1.000000e-01 | 23.360744 | 13.969991 | 14.301613 | 1.237943 | 14.384714 |
[4]:
constraint_points.describe()
[4]:
| easting | northing | true_upward | upward | uncert | weight | inverted_topography | |
|---|---|---|---|---|---|---|---|
| count | 15.000000 | 15.000000 | 15.000000 | 15.000000 | 15.000000 | 15.000000 | 15.000000 |
| mean | 18971.649226 | 16518.655913 | 489.096872 | 487.025168 | 9.781937 | 0.011132 | 490.371197 |
| std | 10839.669022 | 8540.046257 | 79.152932 | 81.118110 | 1.583059 | 0.003039 | 85.481490 |
| min | 3505.581182 | 1697.178371 | 406.379413 | 405.305719 | 8.127588 | 0.005624 | 396.314410 |
| 25% | 11575.107009 | 10553.975772 | 429.926990 | 424.663596 | 8.598540 | 0.009240 | 429.575884 |
| 50% | 19995.535031 | 16357.717739 | 454.924262 | 458.214230 | 9.098485 | 0.012080 | 455.378457 |
| 75% | 27651.208305 | 24233.535276 | 520.183444 | 514.207570 | 10.403669 | 0.013525 | 527.970868 |
| max | 38163.601456 | 27603.626012 | 666.725645 | 668.402196 | 13.334513 | 0.015138 | 673.101002 |
[5]:
true_topography = grids.true
lower_topography = grids.lower
starting_topography = grids.starting
final_topography = grids.inverted
[6]:
topo_results, grav_results, parameters, elapsed_time = inversion_results
[7]:
kwargs
[7]:
{'max_iterations': 200,
 'l2_norm_tolerance': 0.3,
 'delta_l2_norm_tolerance': 1.008}
[8]:
regional_grav_kwargs["constraints_df"] = constraint_points
regional_grav_kwargs
[8]:
{'method': 'constraints',
 'grid_method': 'eq_sources',
 'constraints_weights_column': 'weight',
 'cv': True,
 'cv_kwargs': {'n_trials': 50,
  'damping_limits': (1e-10, 1),
  'progressbar': False,
  'fname': '../tmp/regional_sep'},
 'depth': 'default',
 'block_size': None,
 'constraints_df':          easting      northing  true_upward      upward     uncert    weight  \
 0    3899.714996  26468.618776   666.725645  668.402196  13.334513  0.005624
 1   30636.914105   6974.789900   406.379413  405.305719   8.127588  0.015138
 2   17659.550795  13659.470931   480.393921  486.547024   9.607878  0.010833
 3   28491.676758  27073.768551   517.183455  518.268507  10.343669  0.009347
 4   38163.601456   1697.178371   435.459979  430.794727   8.709200  0.013184
 5   21462.843076  17815.369689   454.924262  458.214230   9.098485  0.012080
 6   20042.577619  27603.626012   411.155008  421.877931   8.223100  0.014789
 7    3737.943068   7448.480613   582.902996  593.944123  11.658060  0.007358
 8   11200.681244  16357.717739   511.624141  504.423182  10.232483  0.009551
 9   19995.535031  26455.594497   450.505648  439.104058   9.010113  0.012318
 10  26810.739853   4728.744481   430.317216  424.953101   8.606344  0.013501
 11  31542.083372  15655.552259   424.023626  424.374090   8.480473  0.013905
 12  15475.763060  22011.476055   429.536764  409.563040   8.590735  0.013550
 13   3505.581182  19732.370745   612.137575  609.458963  12.242752  0.006672
 14  11949.532774  14097.080073   523.183432  510.146633  10.463669  0.009133

     inverted_topography
 0            673.101002
 1            396.314410
 2            484.695498
 3            511.141150
 4            439.034864
 5            455.378457
 6            399.686885
 7            602.485374
 8            522.820073
 9            443.471422
 10           433.165794
 11           415.194669
 12           425.985975
 13           619.970720
 14           533.121663  }
[9]:
starting_topography_kwargs
[9]:
{'method': 'splines',
 'region': (0, 40000, 0, 30000),
 'spacing': 1000,
 'constraints_df':          easting      northing  true_upward      upward     uncert    weight
 0    3899.714996  26468.618776   666.725645  668.402196  13.334513  0.005624
 1   30636.914105   6974.789900   406.379413  405.305719   8.127588  0.015138
 2   17659.550795  13659.470931   480.393921  486.547024   9.607878  0.010833
 3   28491.676758  27073.768551   517.183455  518.268507  10.343669  0.009347
 4   38163.601456   1697.178371   435.459979  430.794727   8.709200  0.013184
 5   21462.843076  17815.369689   454.924262  458.214230   9.098485  0.012080
 6   20042.577619  27603.626012   411.155008  421.877931   8.223100  0.014789
 7    3737.943068   7448.480613   582.902996  593.944123  11.658060  0.007358
 8   11200.681244  16357.717739   511.624141  504.423182  10.232483  0.009551
 9   19995.535031  26455.594497   450.505648  439.104058   9.010113  0.012318
 10  26810.739853   4728.744481   430.317216  424.953101   8.606344  0.013501
 11  31542.083372  15655.552259   424.023626  424.374090   8.480473  0.013905
 12  15475.763060  22011.476055   429.536764  409.563040   8.590735  0.013550
 13   3505.581182  19732.370745   612.137575  609.458963  12.242752  0.006672
 14  11949.532774  14097.080073   523.183432  510.146633  10.463669  0.009133,
 'dampings': array([1.00000000e-40, 2.53536449e-40, 6.42807312e-40, 1.62975083e-39,
        4.13201240e-39, 1.04761575e-38, 2.65608778e-38, 6.73415066e-38,
        1.70735265e-37, 4.32876128e-37, 1.09749877e-36, 2.78255940e-36,
        7.05480231e-36, 1.78864953e-35, 4.53487851e-35, 1.14975700e-34,
        2.91505306e-34, 7.39072203e-34, 1.87381742e-33, 4.75081016e-33,
        1.20450354e-32, 3.05385551e-32, 7.74263683e-32, 1.96304065e-31,
        4.97702356e-31, 1.26185688e-30, 3.19926714e-30, 8.11130831e-30,
        2.05651231e-29, 5.21400829e-29, 1.32194115e-28, 3.35160265e-28,
        8.49753436e-28, 2.15443469e-27, 5.46227722e-27, 1.38488637e-26,
        3.51119173e-26, 8.90215085e-26, 2.25701972e-25, 5.72236766e-25,
        1.45082878e-24, 3.67837977e-24, 9.32603347e-24, 2.36448941e-23,
        5.99484250e-23, 1.51991108e-22, 3.85352859e-22, 9.77009957e-22,
        2.47707636e-21, 6.28029144e-21, 1.59228279e-20, 4.03701726e-20,
        1.02353102e-19, 2.59502421e-19, 6.57933225e-19, 1.66810054e-18,
        4.22924287e-18, 1.07226722e-17, 2.71858824e-17, 6.89261210e-17,
        1.74752840e-16, 4.43062146e-16, 1.12332403e-15, 2.84803587e-15,
        7.22080902e-15, 1.83073828e-14, 4.64158883e-14, 1.17681195e-13,
        2.98364724e-13, 7.56463328e-13, 1.91791026e-12, 4.86260158e-12,
        1.23284674e-11, 3.12571585e-11, 7.92482898e-11, 2.00923300e-10,
        5.09413801e-10, 1.29154967e-09, 3.27454916e-09, 8.30217568e-09,
        2.10490414e-08, 5.33669923e-08, 1.35304777e-07, 3.43046929e-07,
        8.69749003e-07, 2.20513074e-06, 5.59081018e-06, 1.41747416e-05,
        3.59381366e-05, 9.11162756e-05, 2.31012970e-04, 5.85702082e-04,
        1.48496826e-03, 3.76493581e-03, 9.54548457e-03, 2.42012826e-02,
        6.13590727e-02, 1.55567614e-01, 3.94420606e-01, 1.00000000e+00]),
 'weights_col': 'weight'}
11. Extract parameters#
[10]:
parameters
[10]:
{'Density contrast(s)': '[2735] kg/m3',
 'Reference level': '492.79238528548717 m',
 'Max iterations': 200,
 'L2 norm tolerance': '0.3',
 'Delta L2 norm tolerance': '1.008',
 'Deriv type': 'annulus',
 'Solver type': 'scipy least squares',
 'Solver damping': 0.02239318117126179,
 'Upper confining layer': 'Not enabled',
 'Lower confining layer': 'Not enabled',
 'Regularization weighting grid': 'Not enabled',
 'Time elapsed': '5 seconds',
 'Avg. iteration time': '1.84 seconds',
 'Final misfit RMSE / L2-norm': '0.0698 /0.2642 mGal',
 'Termination reason': ['l2-norm tolerance'],
 'Iteration times': [2.1698128759999236,
  1.558914330999869,
  1.8062508599996363]}
[11]:
density_contrast = float(parameters["Density contrast(s)"][1:-7])
zref = float(parameters["Reference level"][:-2])
spacing = utils.get_spacing(grav_df)
region = vd.get_region((grav_df.easting, grav_df.northing))
solver_damping = parameters["Solver damping"]

print(f"Density contrast: {density_contrast} kg/m3")
print(f"Reference level: {zref} m")
print(f"Spacing: {spacing} m")
print(f"Region: {region}")
print(f"Solver damping: {solver_damping}")
Density contrast: 2735.0 kg/m3
Reference level: 492.79238528548717 m
Spacing: 500.0 m
Region: (np.float64(0.0), np.float64(40000.0), np.float64(0.0), np.float64(30000.0))
Solver damping: 0.02239318117126179
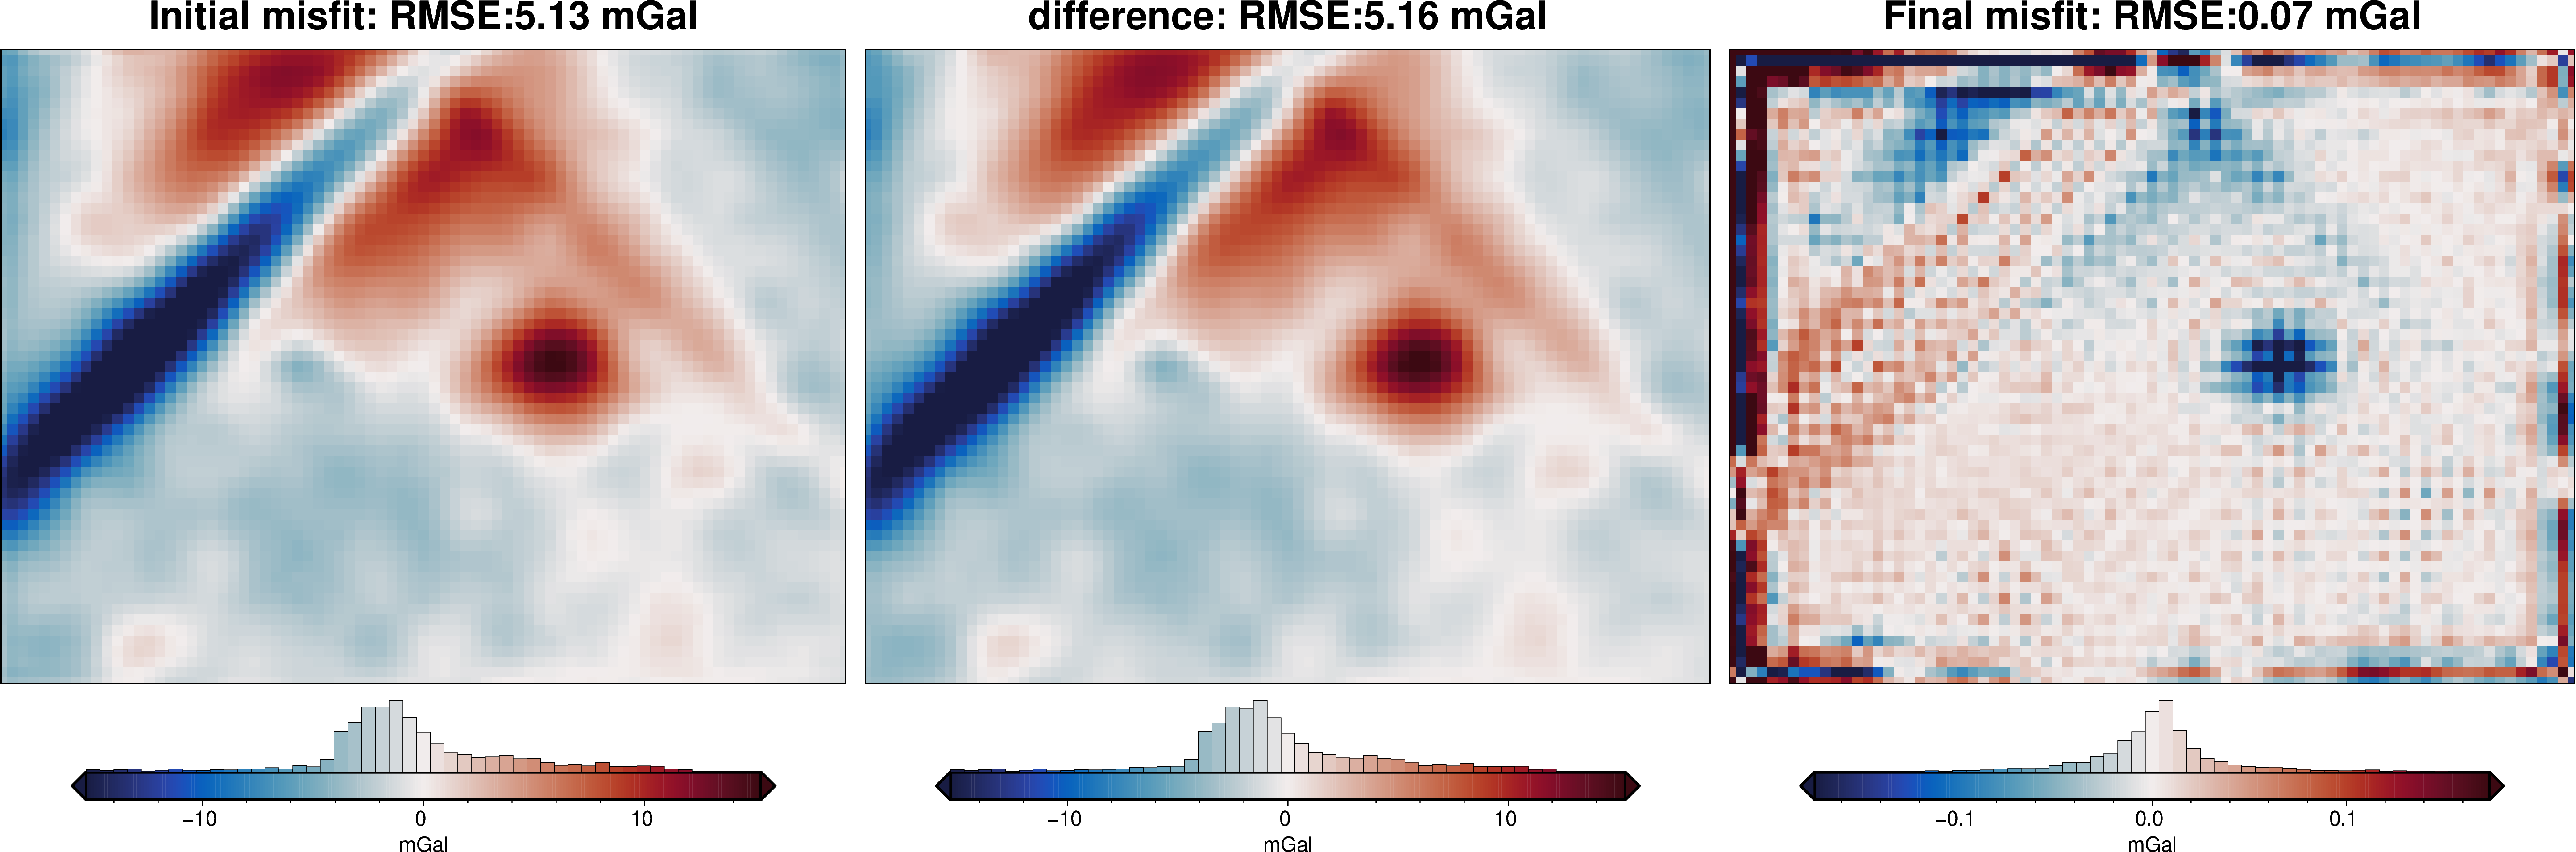
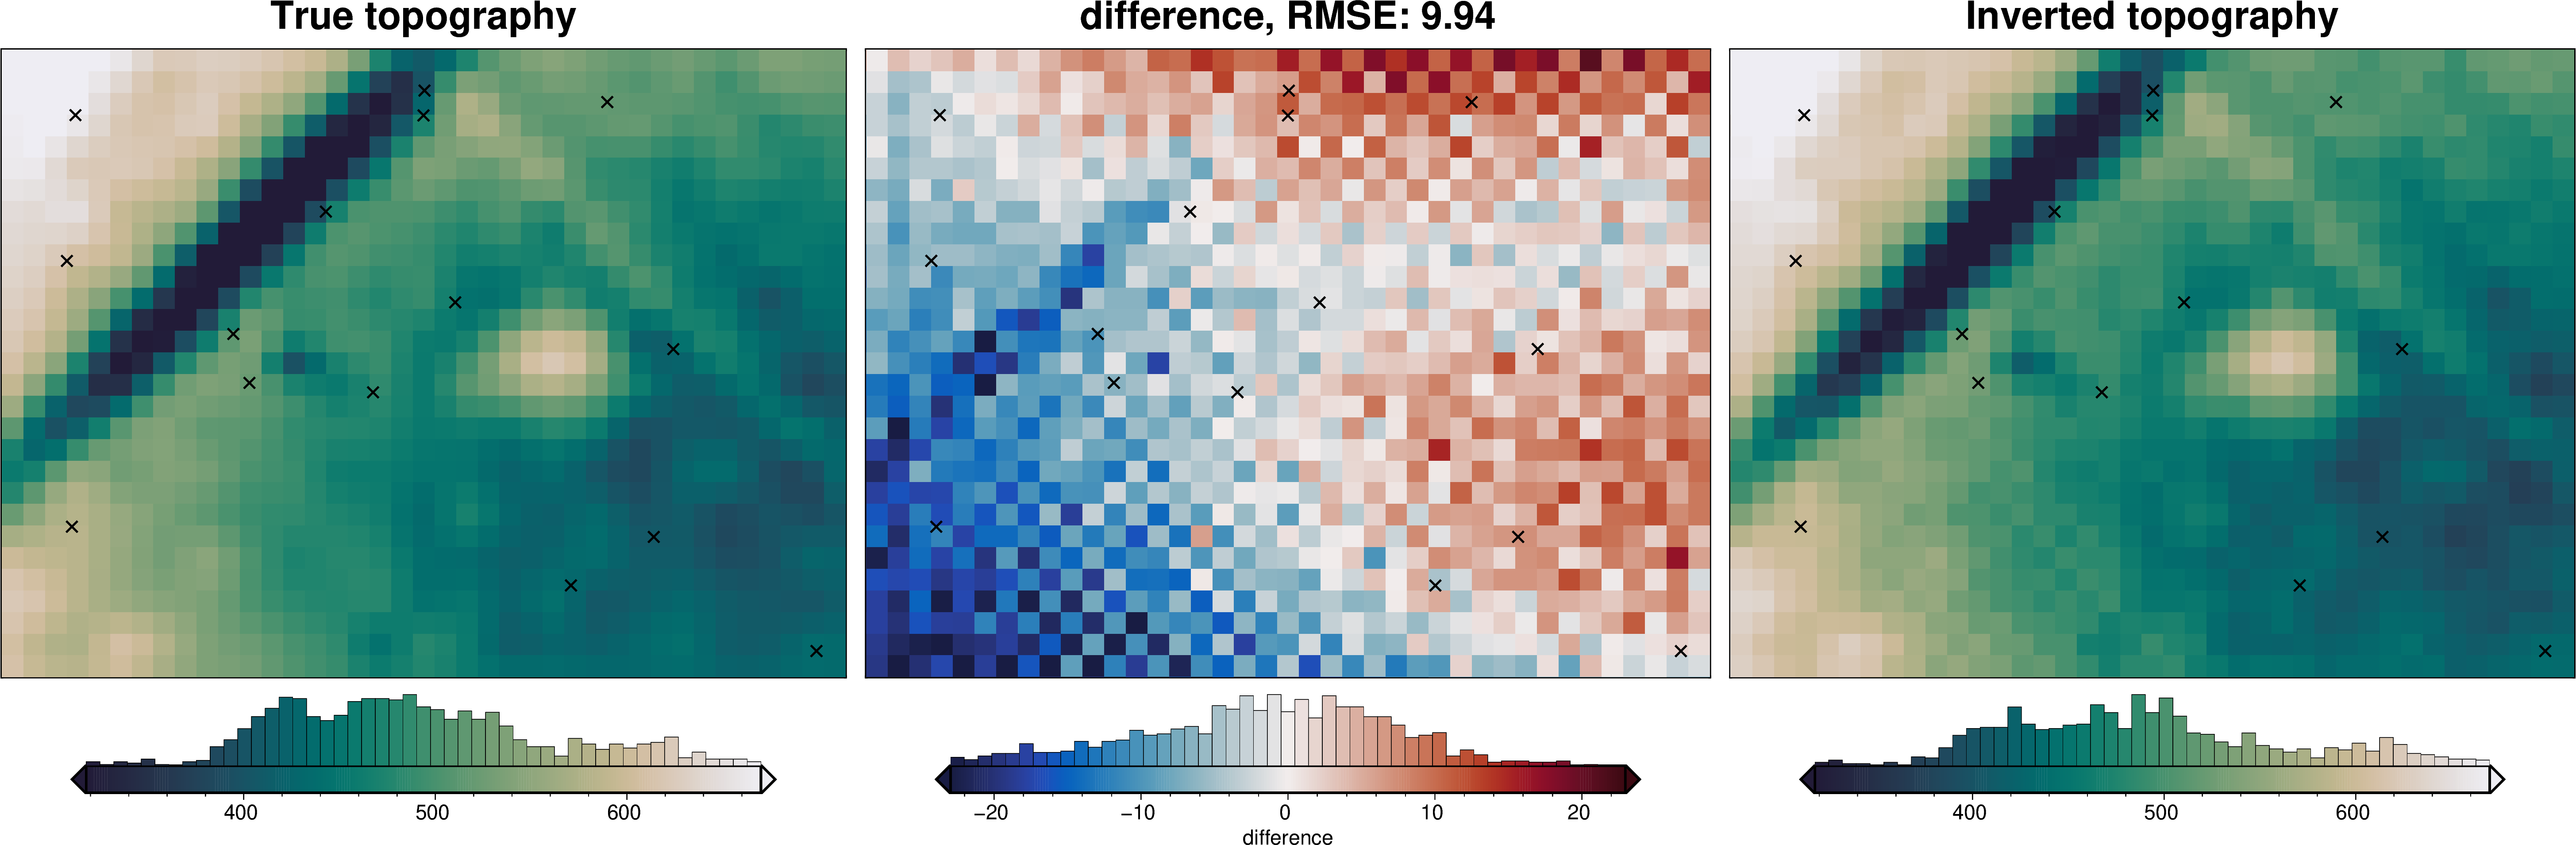
[12]:
# collect the results
topo_results, grav_results, parameters, elapsed_time = inversion_results
plotting.plot_inversion_results(
grav_results,
topo_results,
parameters,
region,
iters_to_plot=2,
plot_iter_results=False,
plot_topo_results=True,
plot_grav_results=True,
)
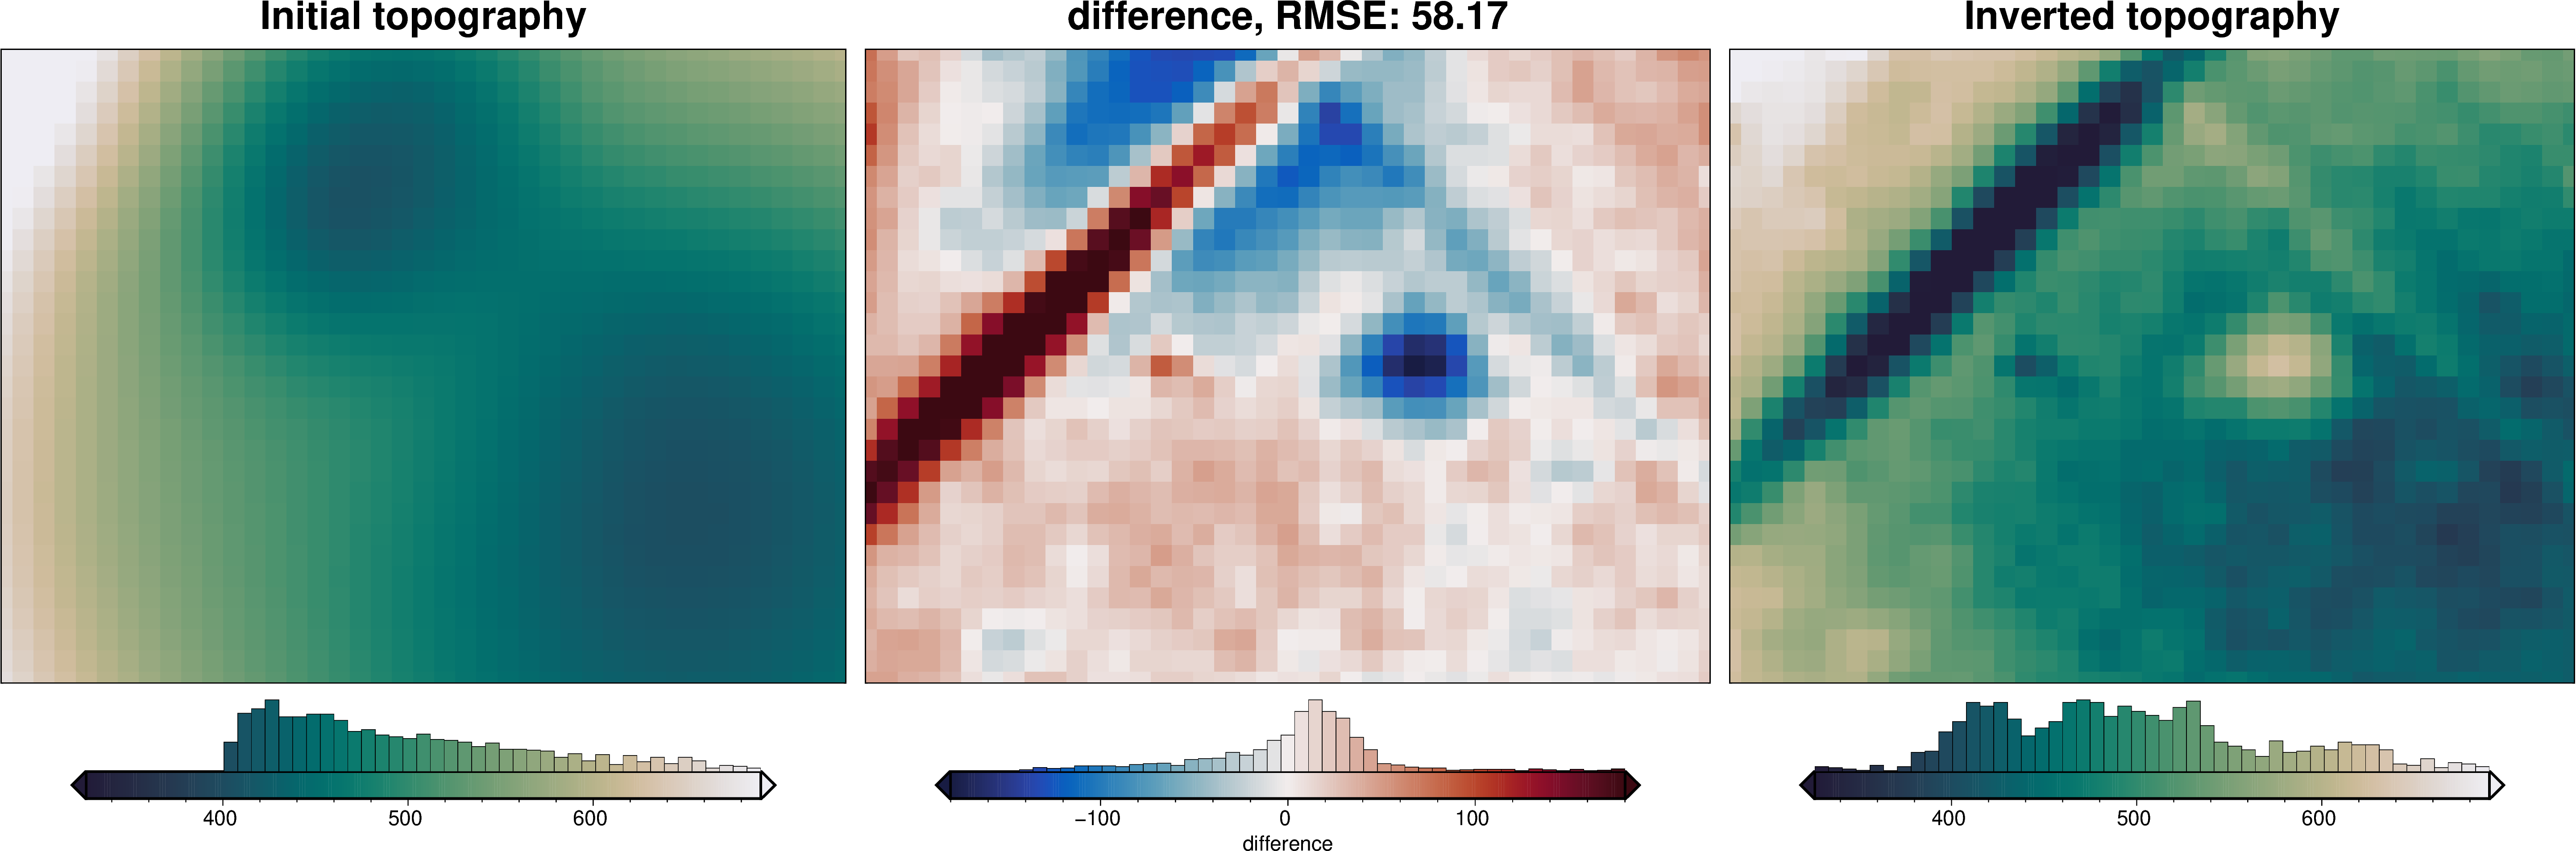
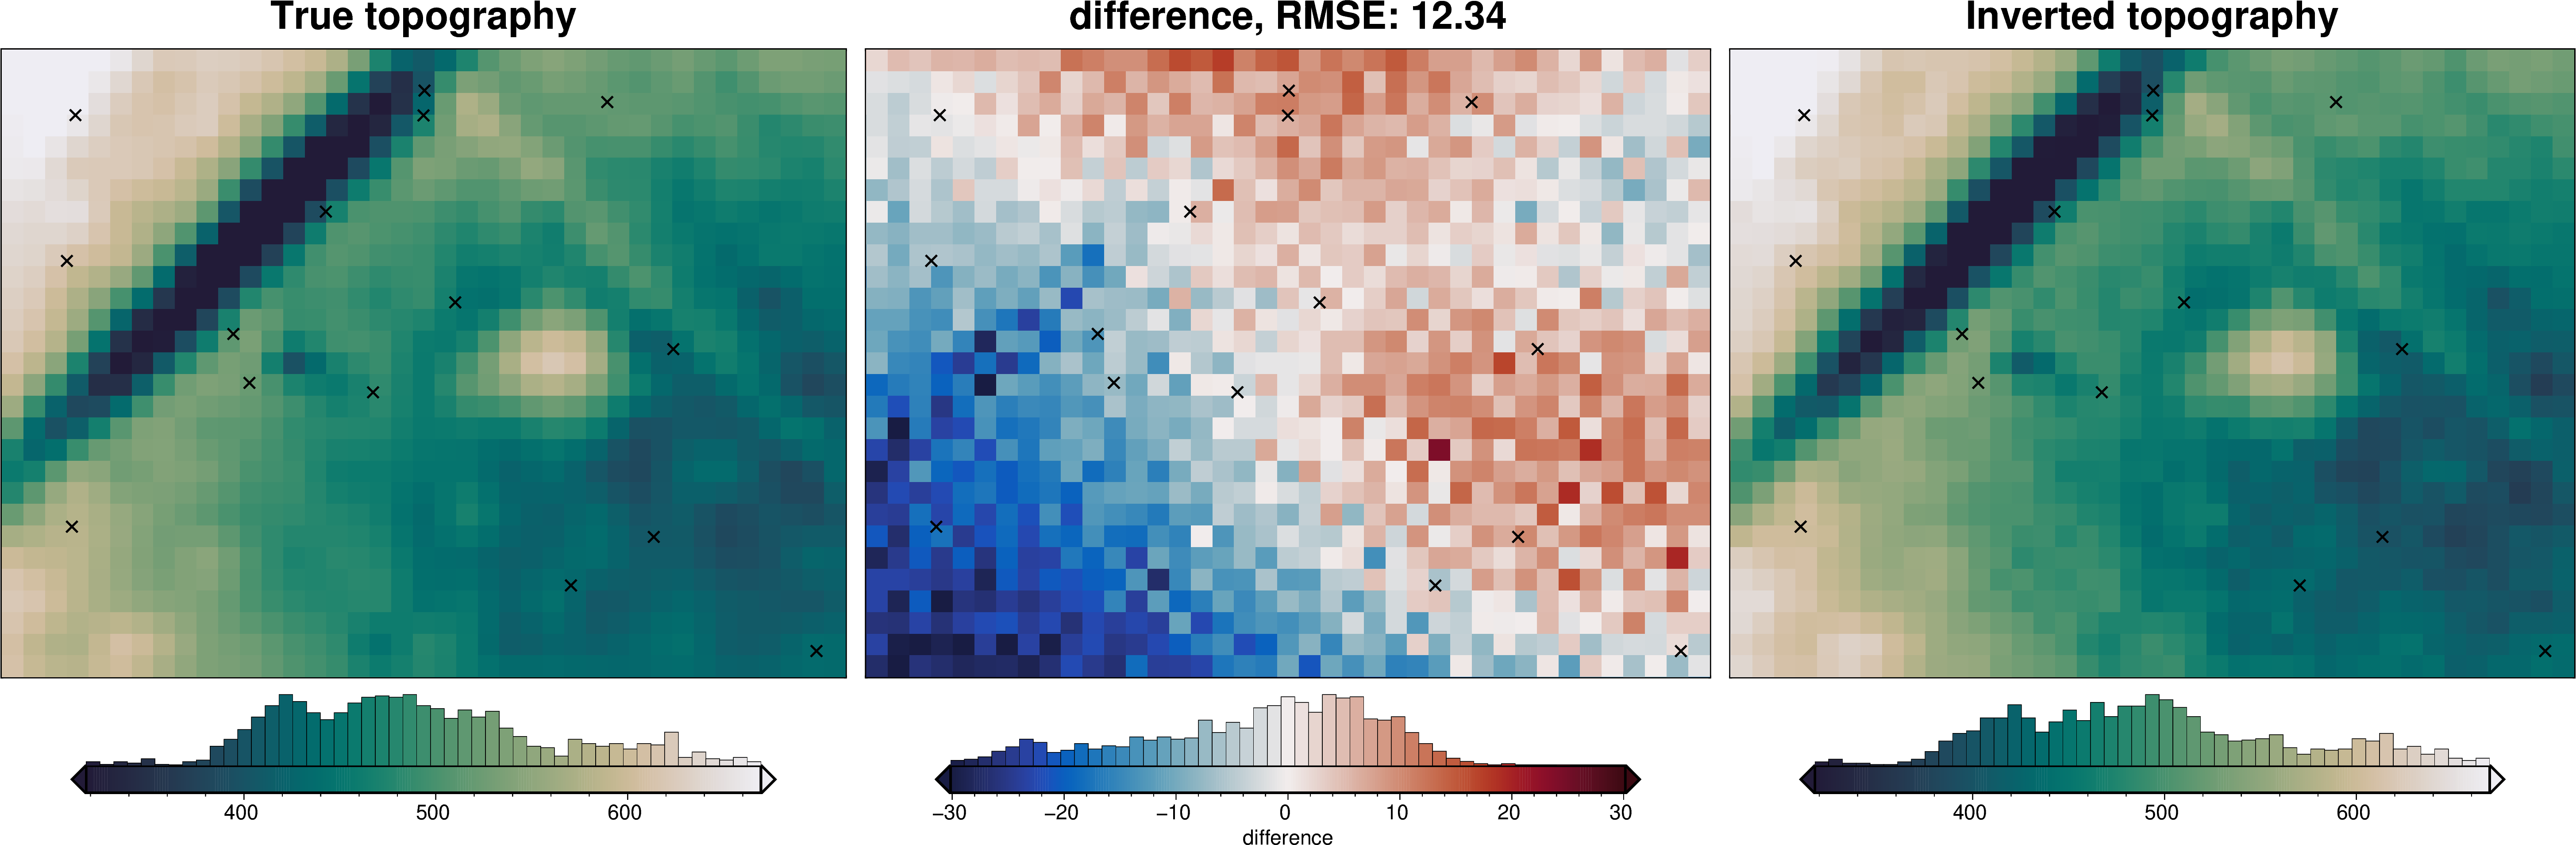
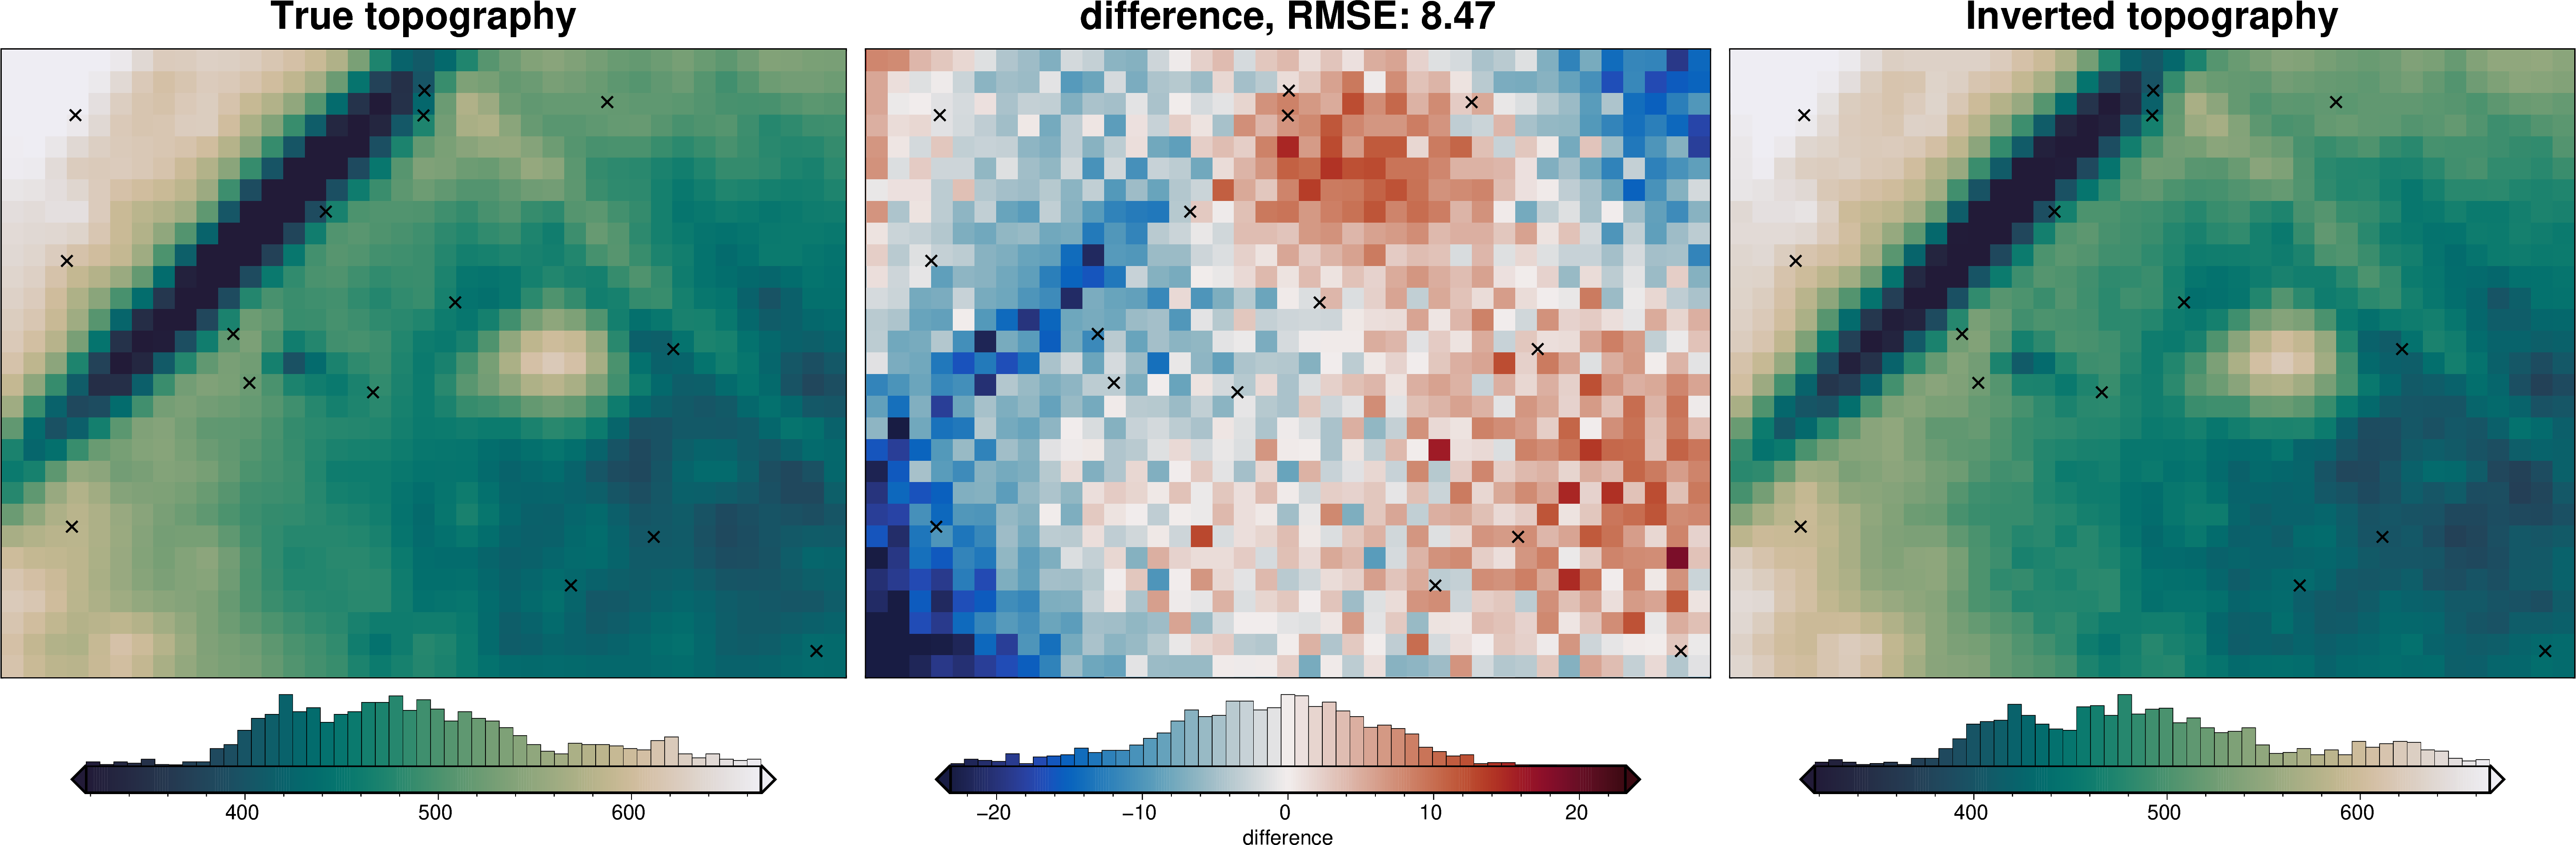
final_topography = topo_results.set_index(["northing", "easting"]).to_xarray().topo
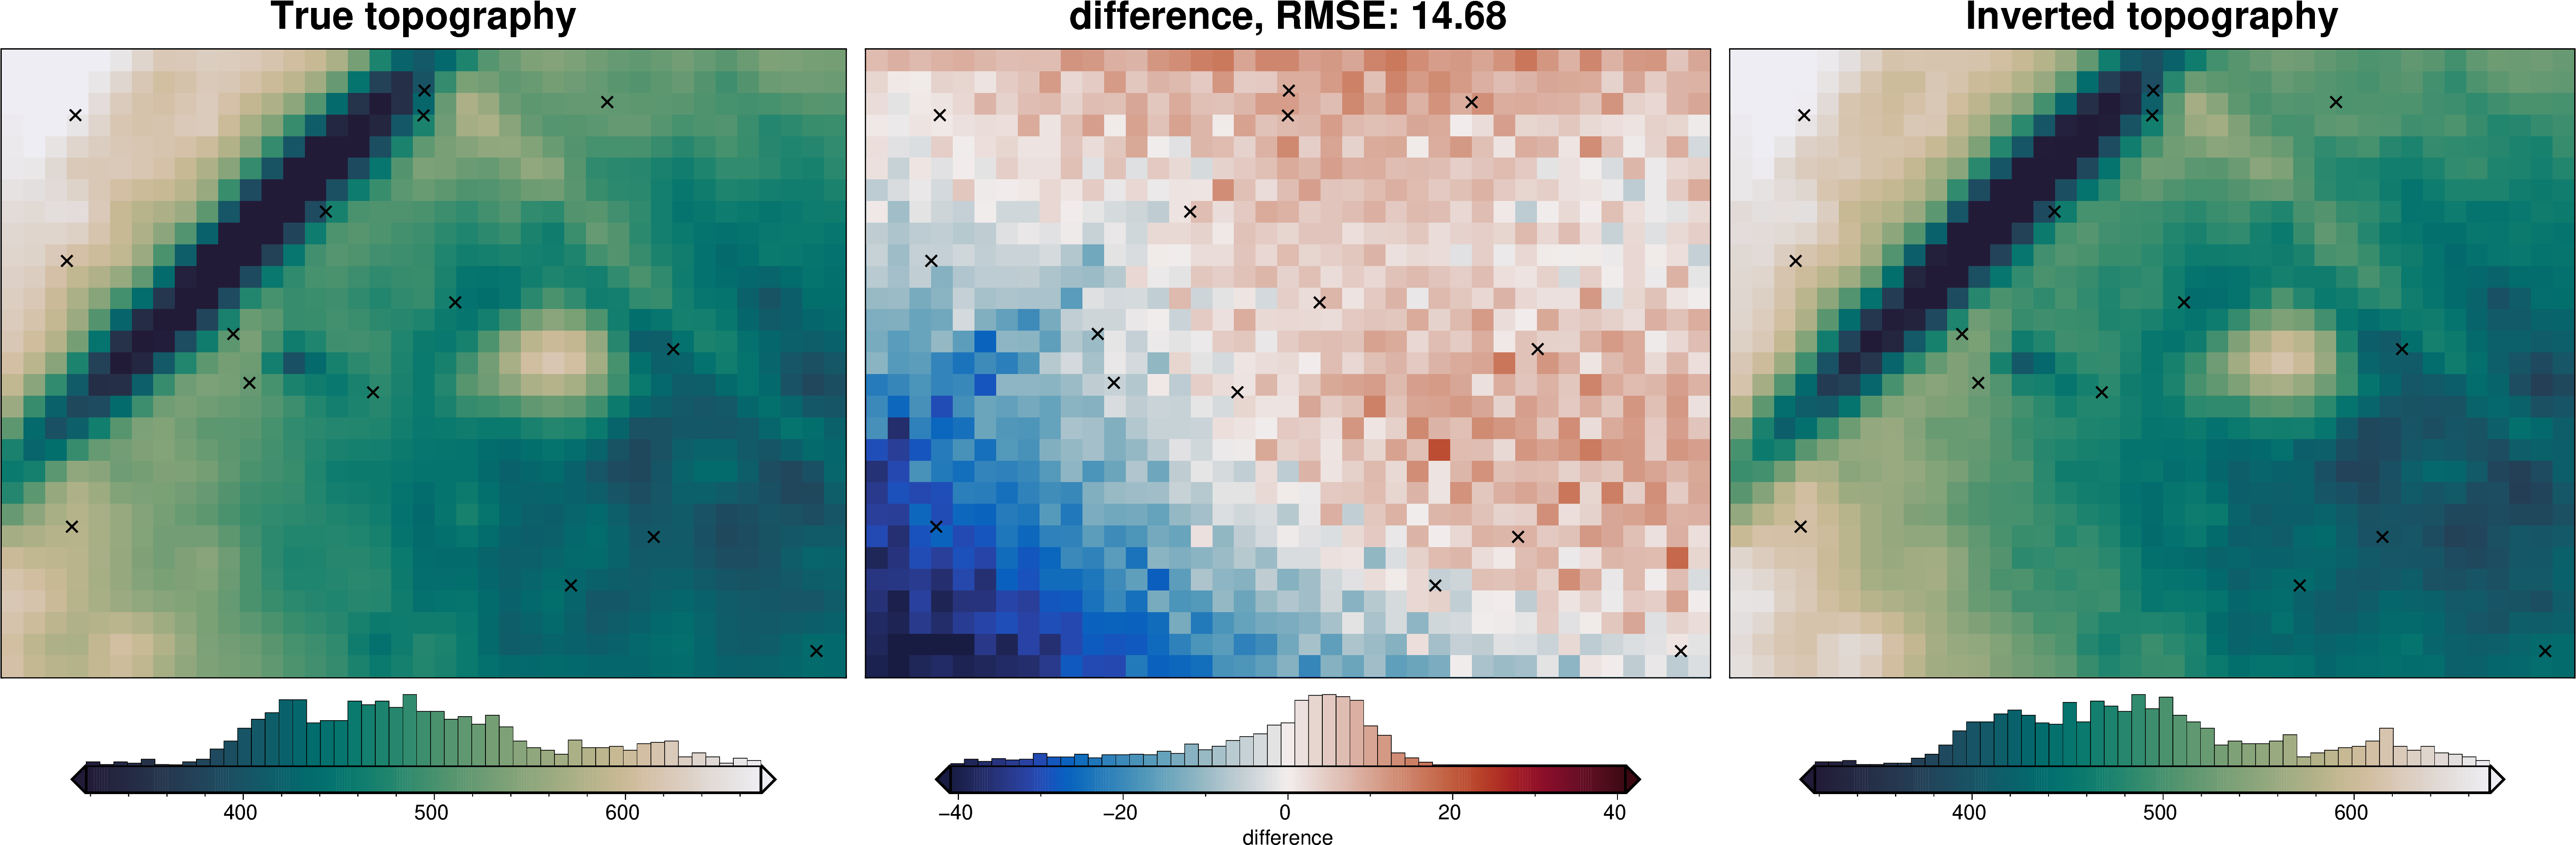
_ = polar_utils.grd_compare(
true_topography,
final_topography,
grid1_name="True topography",
grid2_name="Inverted topography",
robust=True,
hist=True,
title="difference",
grounding_line=False,
reverse_cpt=True,
cmap="rain",
points=constraint_points,
points_style="x.3c",
)
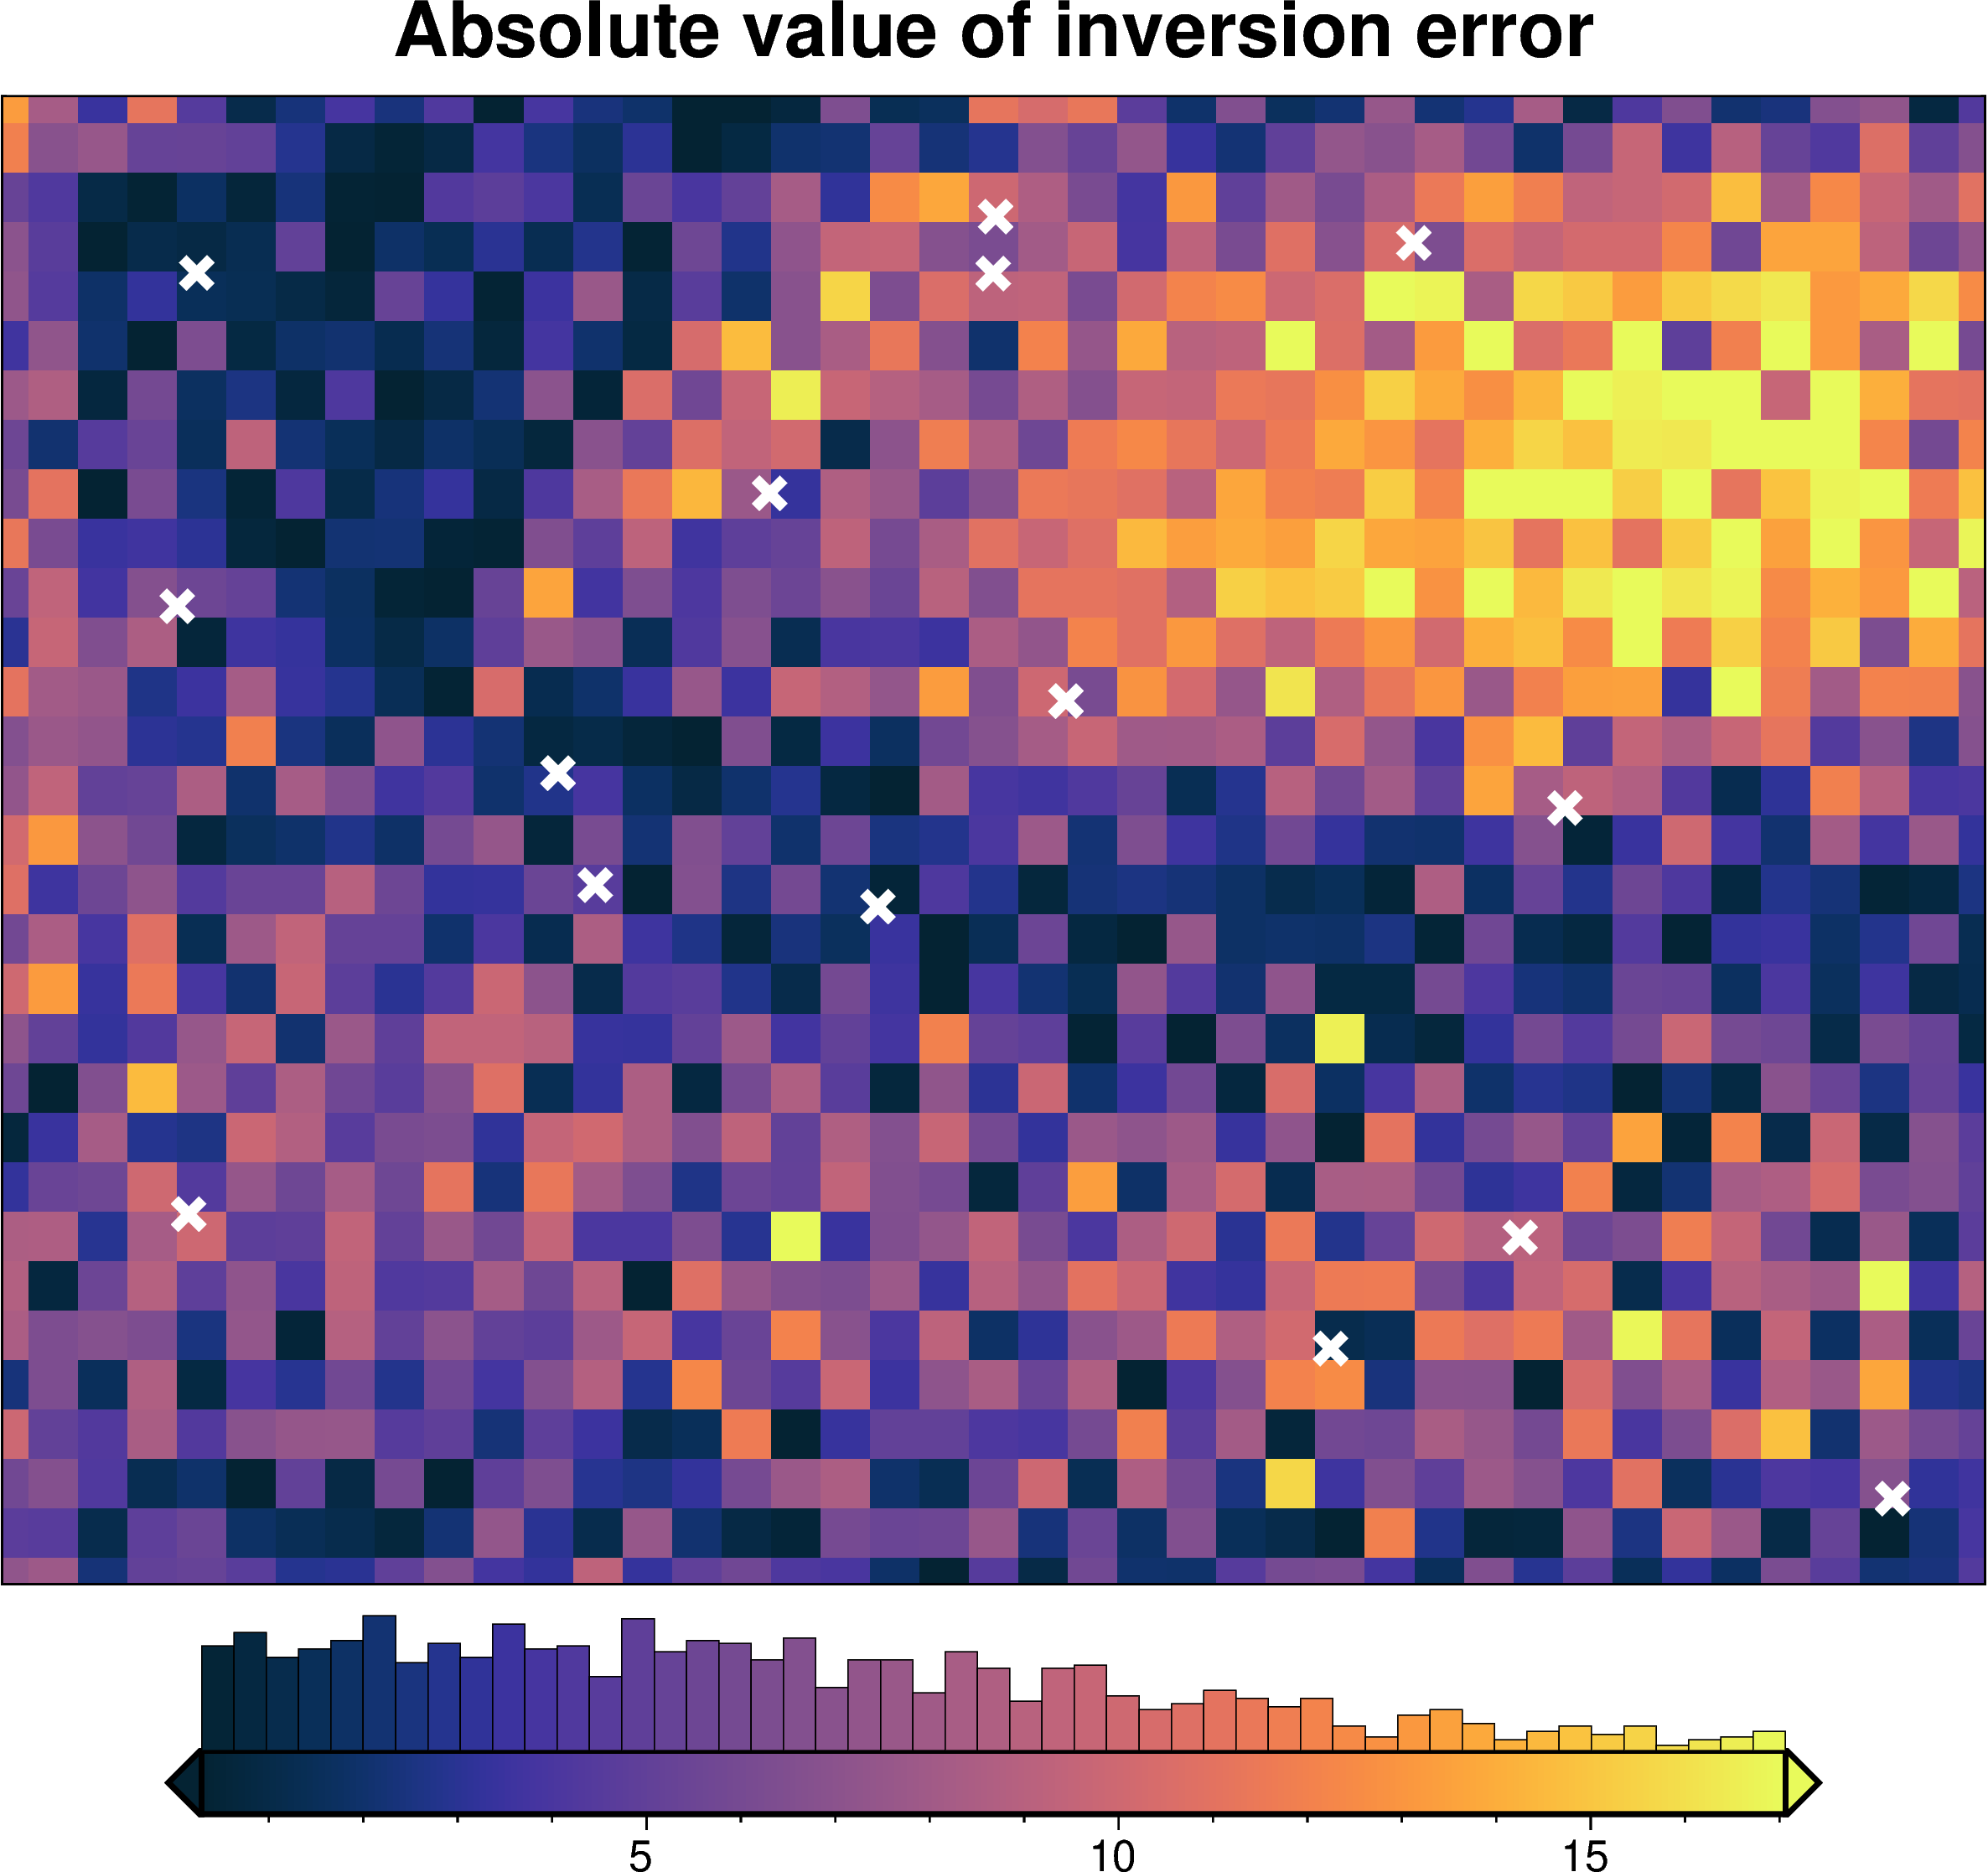
12. Absolute value of inversion error#
[13]:
inversion_error = np.abs(true_topography - final_topography)
fig = maps.plot_grd(
    inversion_error,
    hist=True,
    cmap="thermal",
    title="Absolute value of inversion error",
    robust=True,
    points=constraint_points,
    points_style="x.4c,",
    points_pen="3p",
    points_fill="white",
)
fig.show()
plot [WARNING]: .4c, not a valid number and may not be decoded properly.
13. Redo starting gravity and regional separation#
use the optimal determined density contrast and zref values
[14]:
# set the reference level from the prisms to 0
density_grid = xr.where(
    starting_topography >= zref,
    density_contrast,
    -density_contrast,
)
# create layer of prisms
starting_prisms = utils.grids_to_prisms(
    starting_topography,
    zref,
    density=density_grid,
)
grav_df["starting_gravity"] = starting_prisms.prism_layer.gravity(
    coordinates=(
        grav_df.easting,
        grav_df.northing,
        grav_df.upward,
    ),
    field="g_z",
    progressbar=False,
)

# regional separation
temp_reg_kwargs = copy.deepcopy(regional_grav_kwargs)

# temporarily set some kwargs
# temp_reg_kwargs["cv_kwargs"]["plot"]=True
temp_reg_kwargs["cv_kwargs"]["progressbar"] = True

grav_df = regional.regional_separation(
    grav_df=grav_df,
    **temp_reg_kwargs,
)

grav_df["staring_res"] = grav_df.res
grav_df["starting_reg"] = grav_df.reg

grav_df.describe()
INFO:invert4geom:using 12 startup trials
INFO:invert4geom:Trial with best score:
INFO:invert4geom:       trial number: 41
INFO:invert4geom:       parameter: {'damping': 0.04881091466863527}
INFO:invert4geom:       scores: [-0.3044137588089442]
[14]:
| northing | easting | upward | upper_surface_grav | lower_surface_grav | observed_grav | gravity_anomaly | uncert | starting_gravity | true_res | misfit | reg | res | staring_res | starting_reg | |
|---|---|---|---|---|---|---|---|---|---|---|---|---|---|---|---|
| count | 4941.000000 | 4941.000000 | 4941.0 | 4941.000000 | 4941.000000 | 4941.000000 | 4941.000000 | 4.941000e+03 | 4941.000000 | 4941.000000 | 4941.000000 | 4941.000000 | 4941.000000 | 4941.000000 | 4941.000000 |
| mean | 15000.000000 | 20000.000000 | 1001.0 | -0.229678 | 0.004286 | -0.225392 | -0.225332 | 1.000000e-01 | 0.517690 | -1.254871 | -0.743022 | -0.134885 | -0.608137 | -0.608137 | -0.134885 |
| std | 8804.299419 | 11691.635129 | 0.0 | 7.103507 | 0.720692 | 7.247722 | 7.245591 | 1.064189e-10 | 7.538787 | 4.621594 | 5.076524 | 1.376126 | 4.572632 | 4.572632 | 1.376126 |
| min | 0.000000 | 0.000000 | 1001.0 | -17.227928 | -1.034071 | -16.940400 | -17.040892 | 1.000000e-01 | -9.430753 | -19.592049 | -20.057107 | -2.560355 | -18.518955 | -18.518955 | -2.560355 |
| 25% | 7500.000000 | 10000.000000 | 1001.0 | -5.587227 | -0.610336 | -5.906763 | -5.910496 | 1.000000e-01 | -5.500220 | -3.008015 | -2.800362 | -1.230061 | -2.338344 | -2.338344 | -1.230061 |
| 50% | 15000.000000 | 20000.000000 | 1001.0 | -1.239580 | -0.155380 | -0.822890 | -0.813296 | 1.000000e-01 | -1.442872 | -1.483188 | -1.207388 | -0.191240 | -0.616647 | -0.616647 | -0.191240 |
| 75% | 22500.000000 | 30000.000000 | 1001.0 | 3.490030 | 0.542849 | 3.738912 | 3.726649 | 1.000000e-01 | 5.248543 | 0.577570 | 1.437138 | 1.026287 | 1.260866 | 1.260866 | 1.026287 |
| max | 30000.000000 | 40000.000000 | 1001.0 | 19.754954 | 1.602413 | 19.932831 | 19.959187 | 1.000000e-01 | 25.047338 | 13.969991 | 15.352249 | 2.279162 | 14.666685 | 14.666685 | 2.279162 |
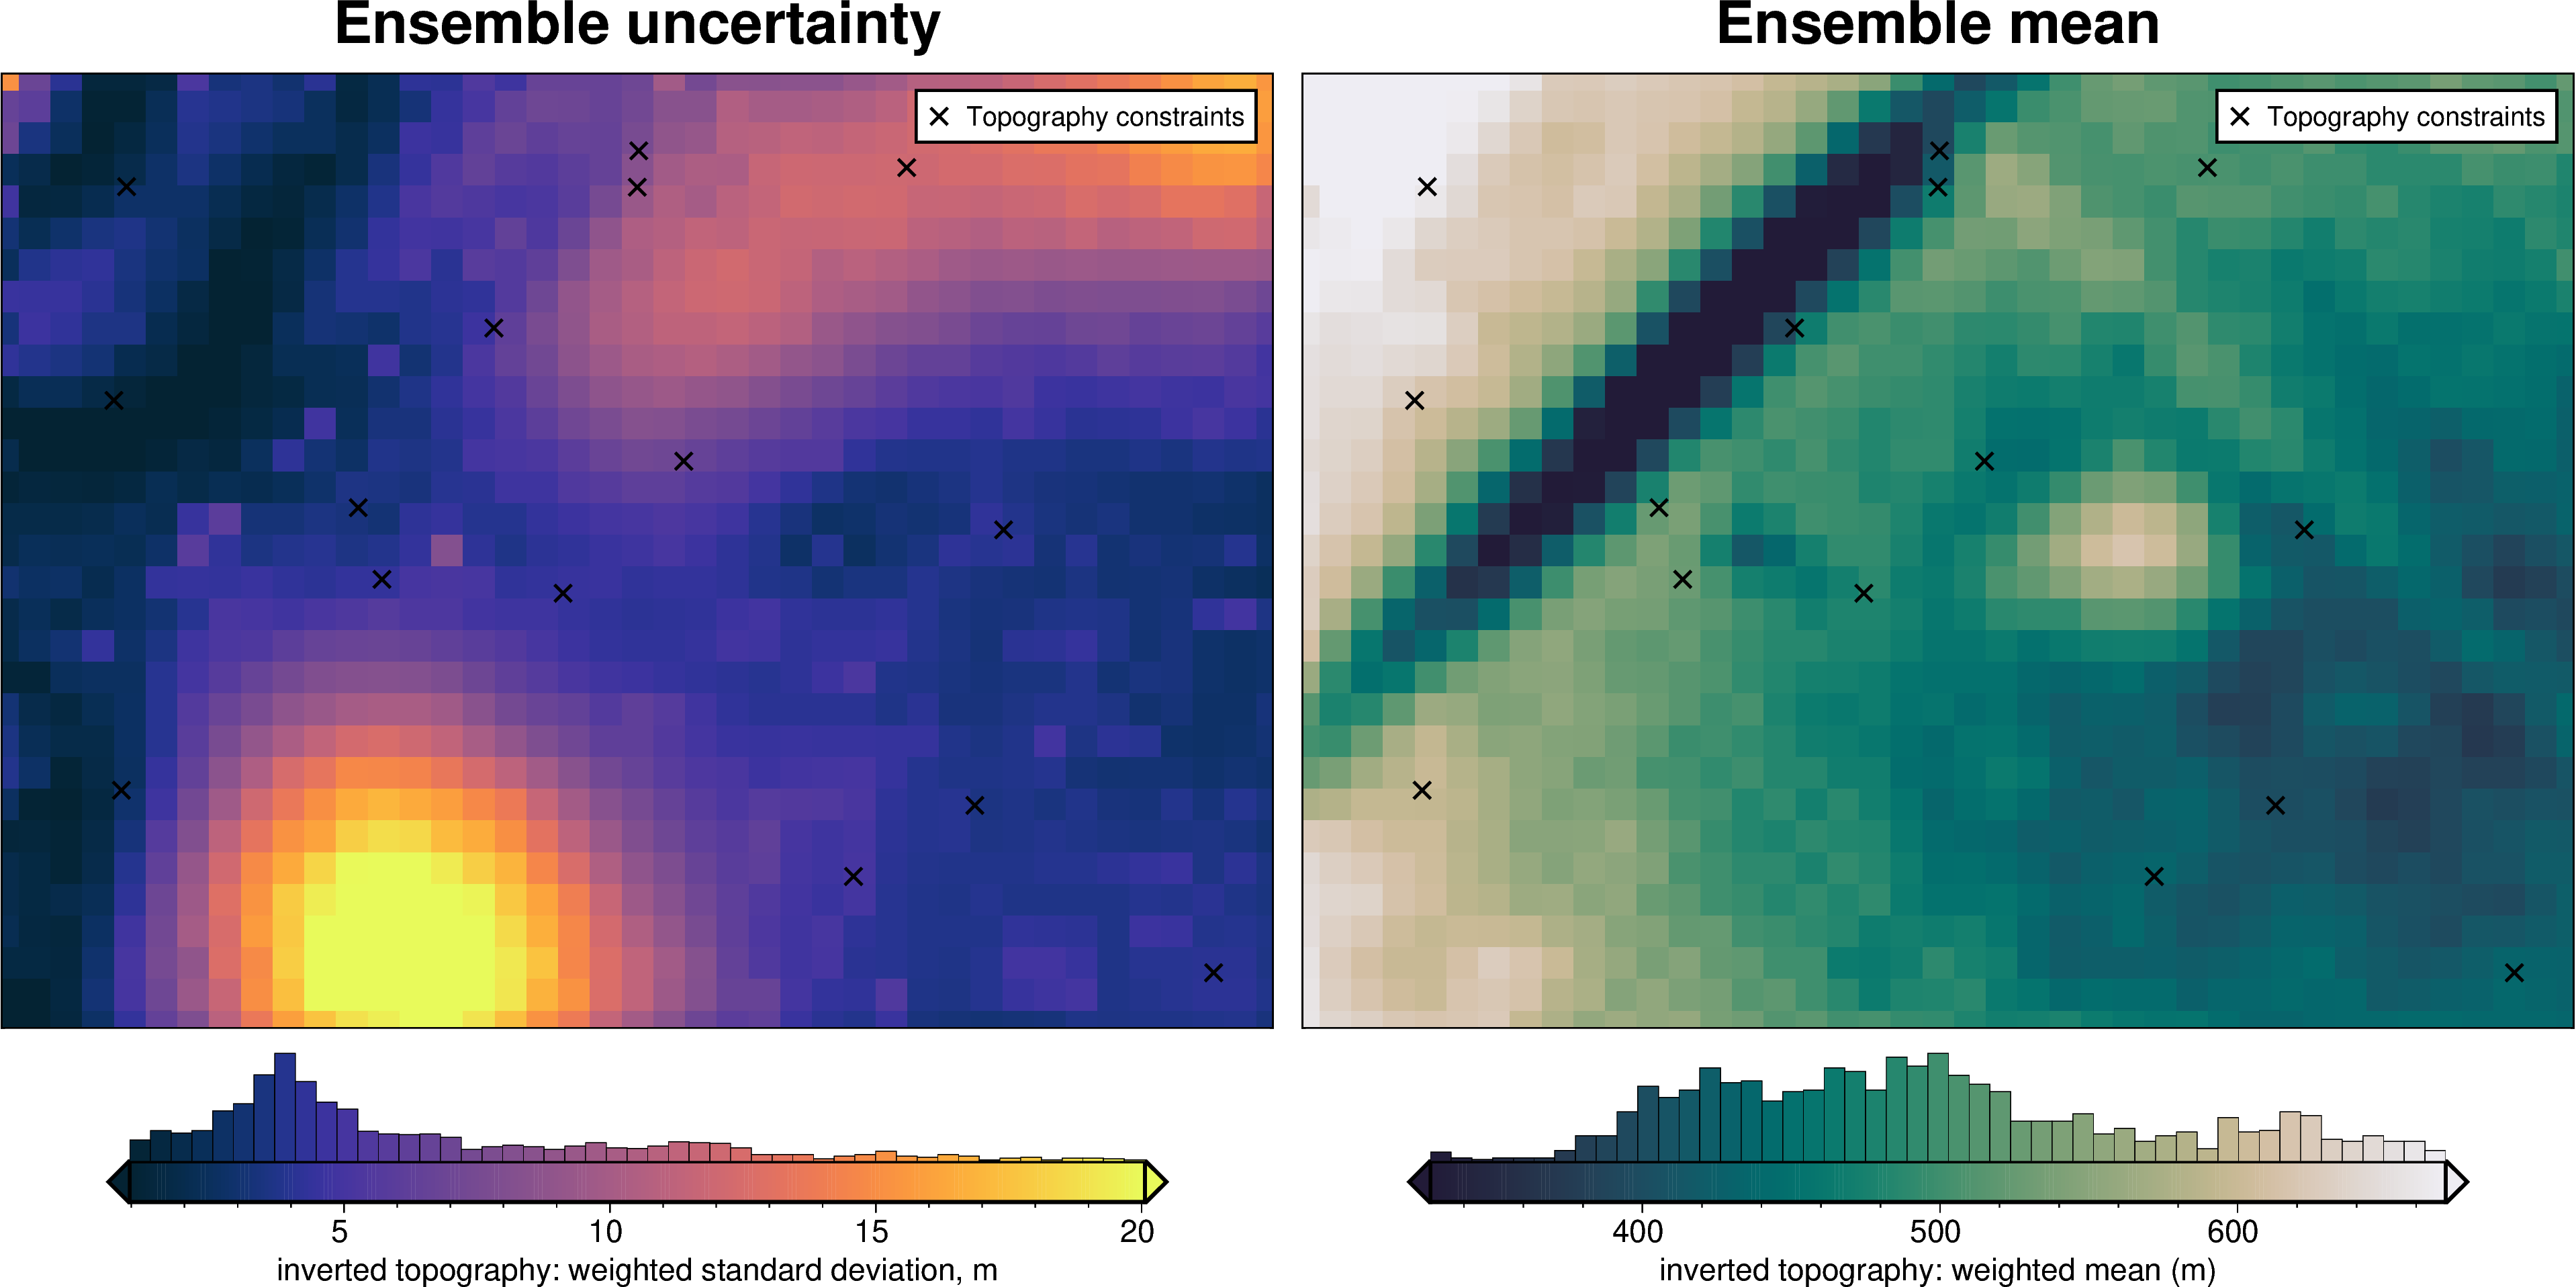
[15]:
# plotting functions for uncertainty results
def uncert_plots(
results,
inversion_region,
spacing,
true_topography,
constraint_points=None,
weight_by=None,
):
if (weight_by == "constraints") & (constraint_points is None):
msg = "must provide constraint_points if weighting by constraints"
raise ValueError(msg)
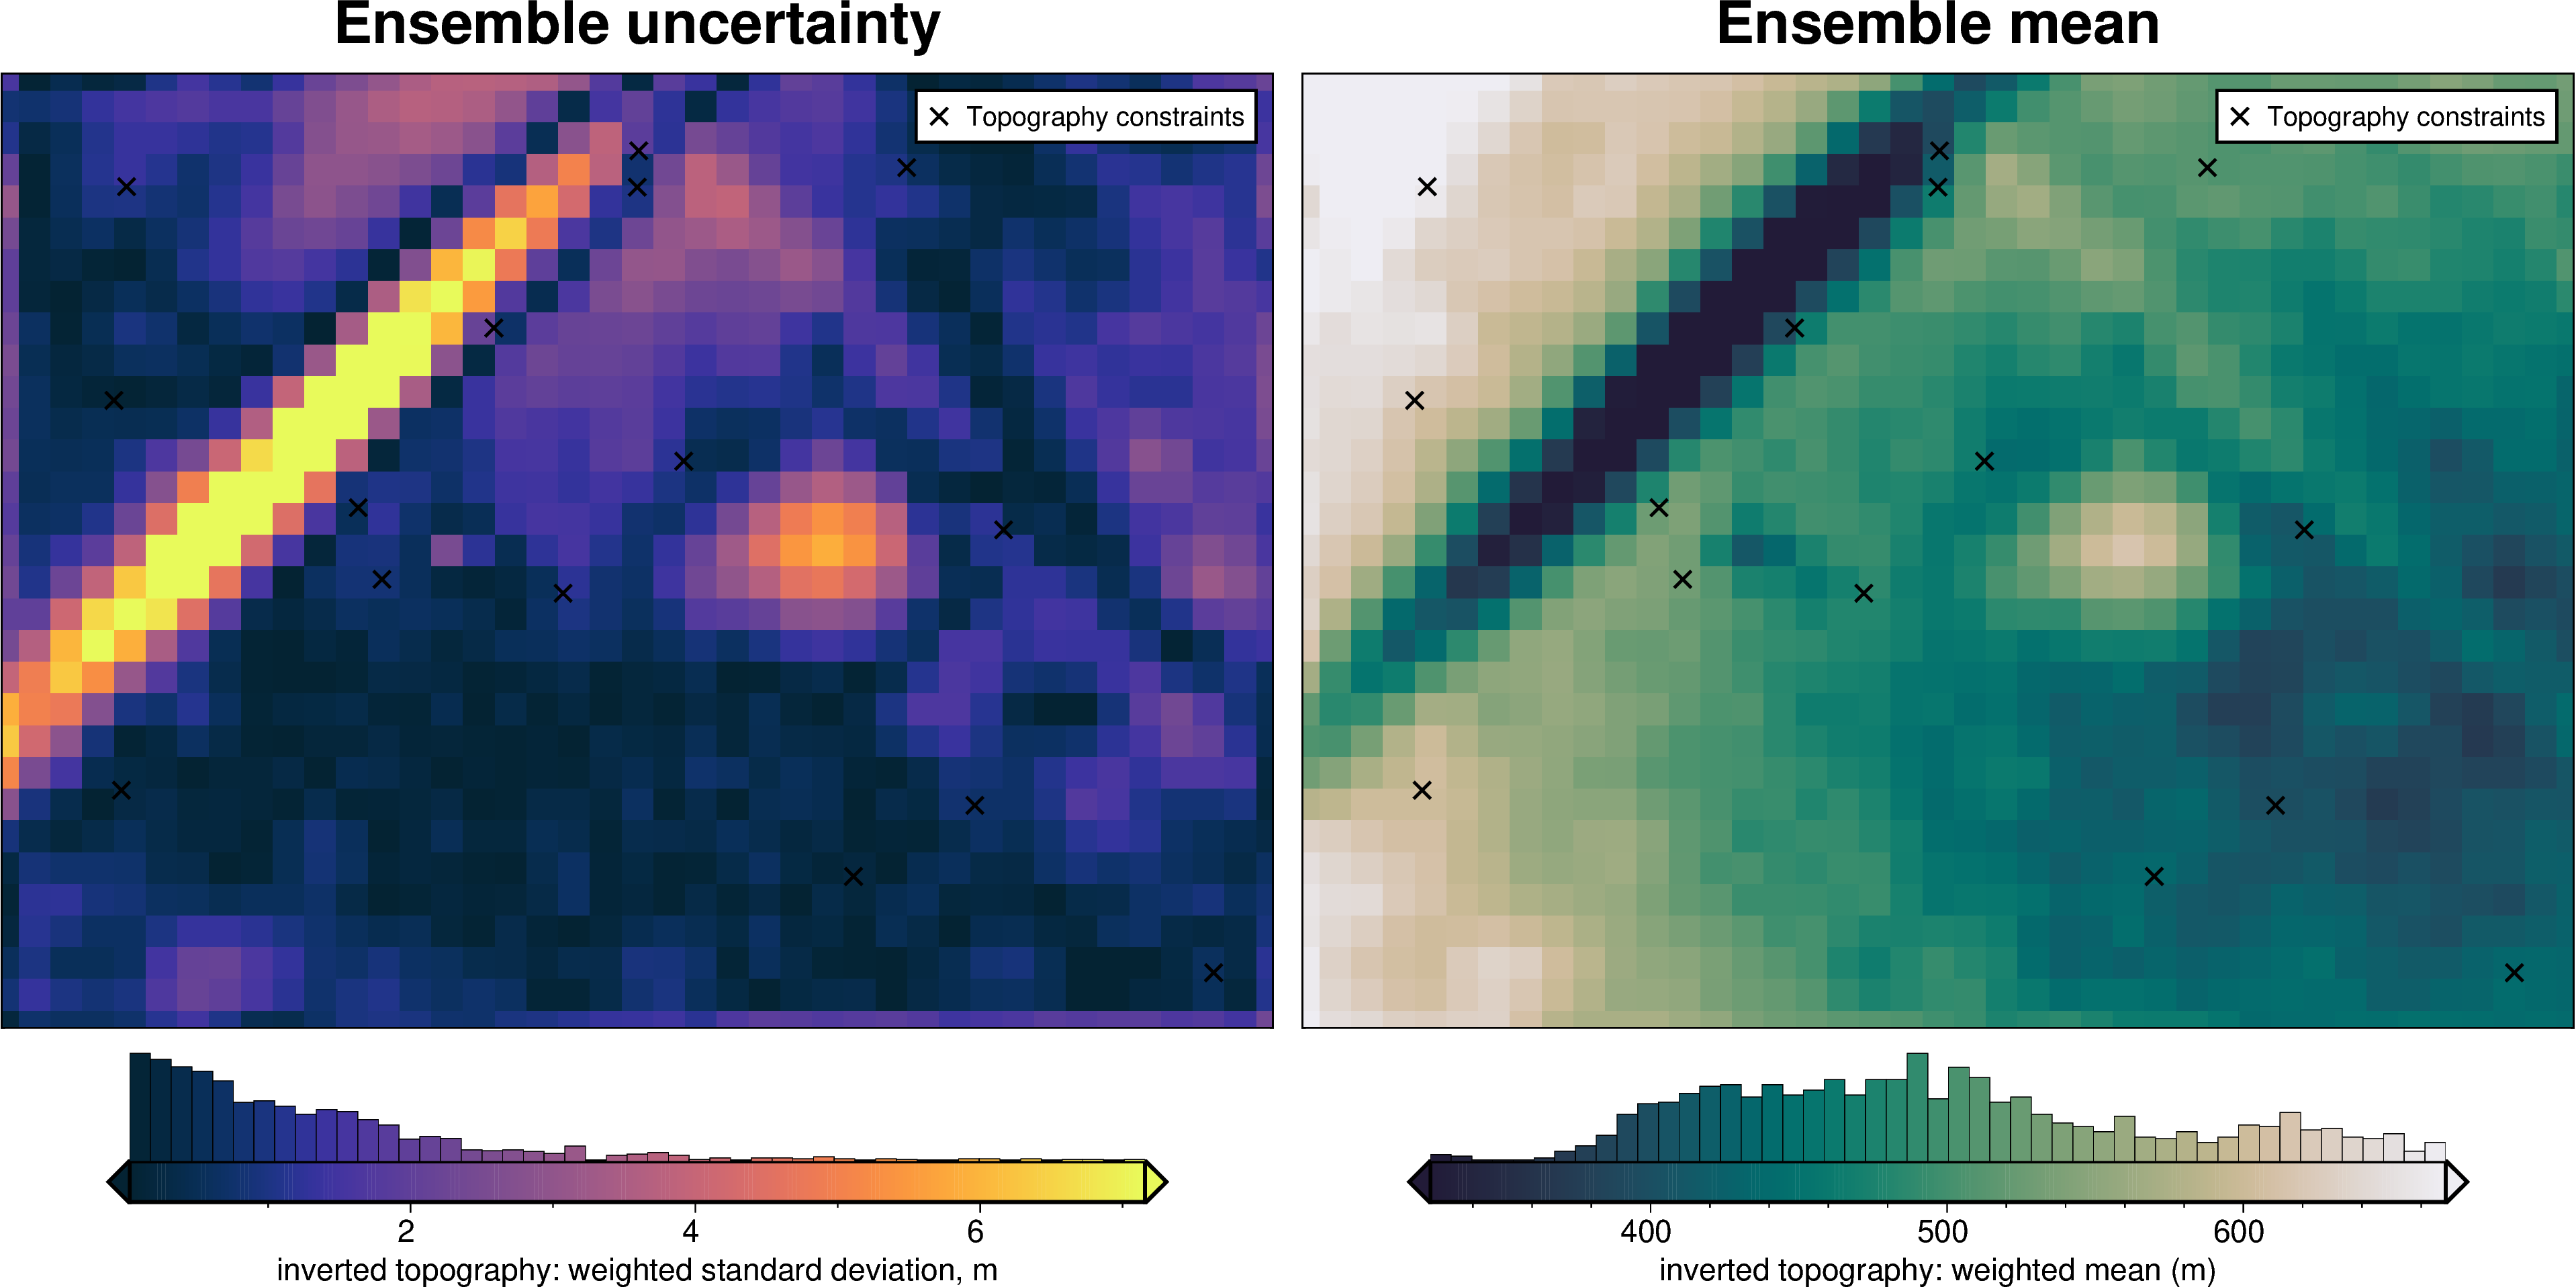
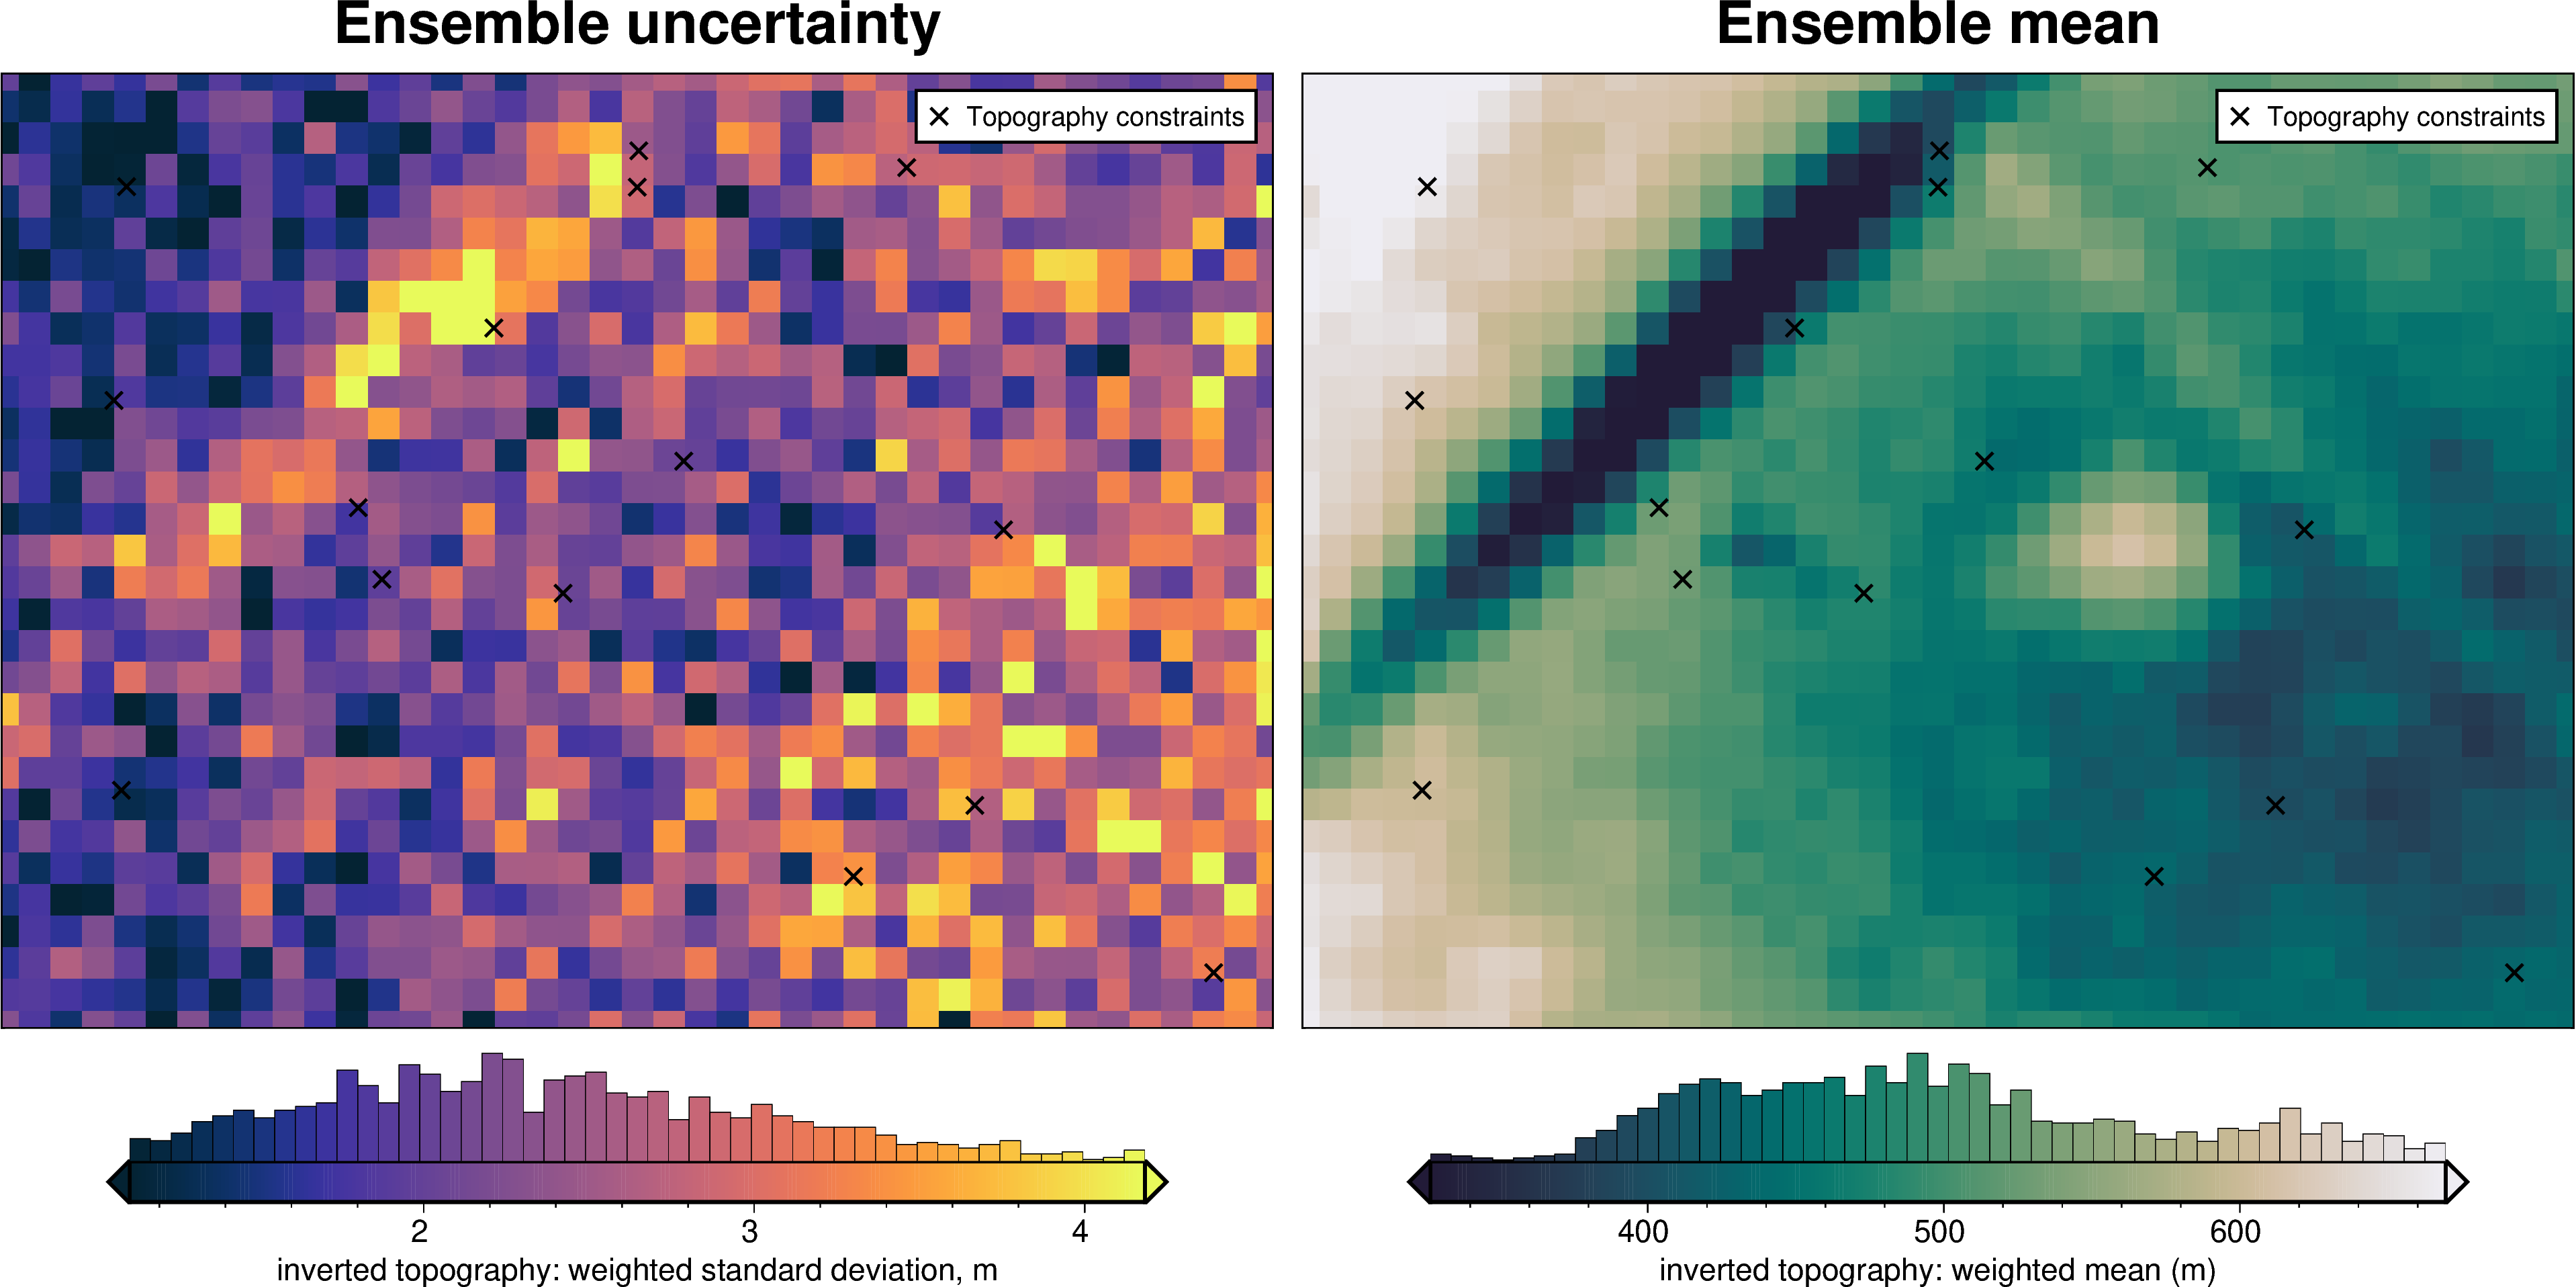
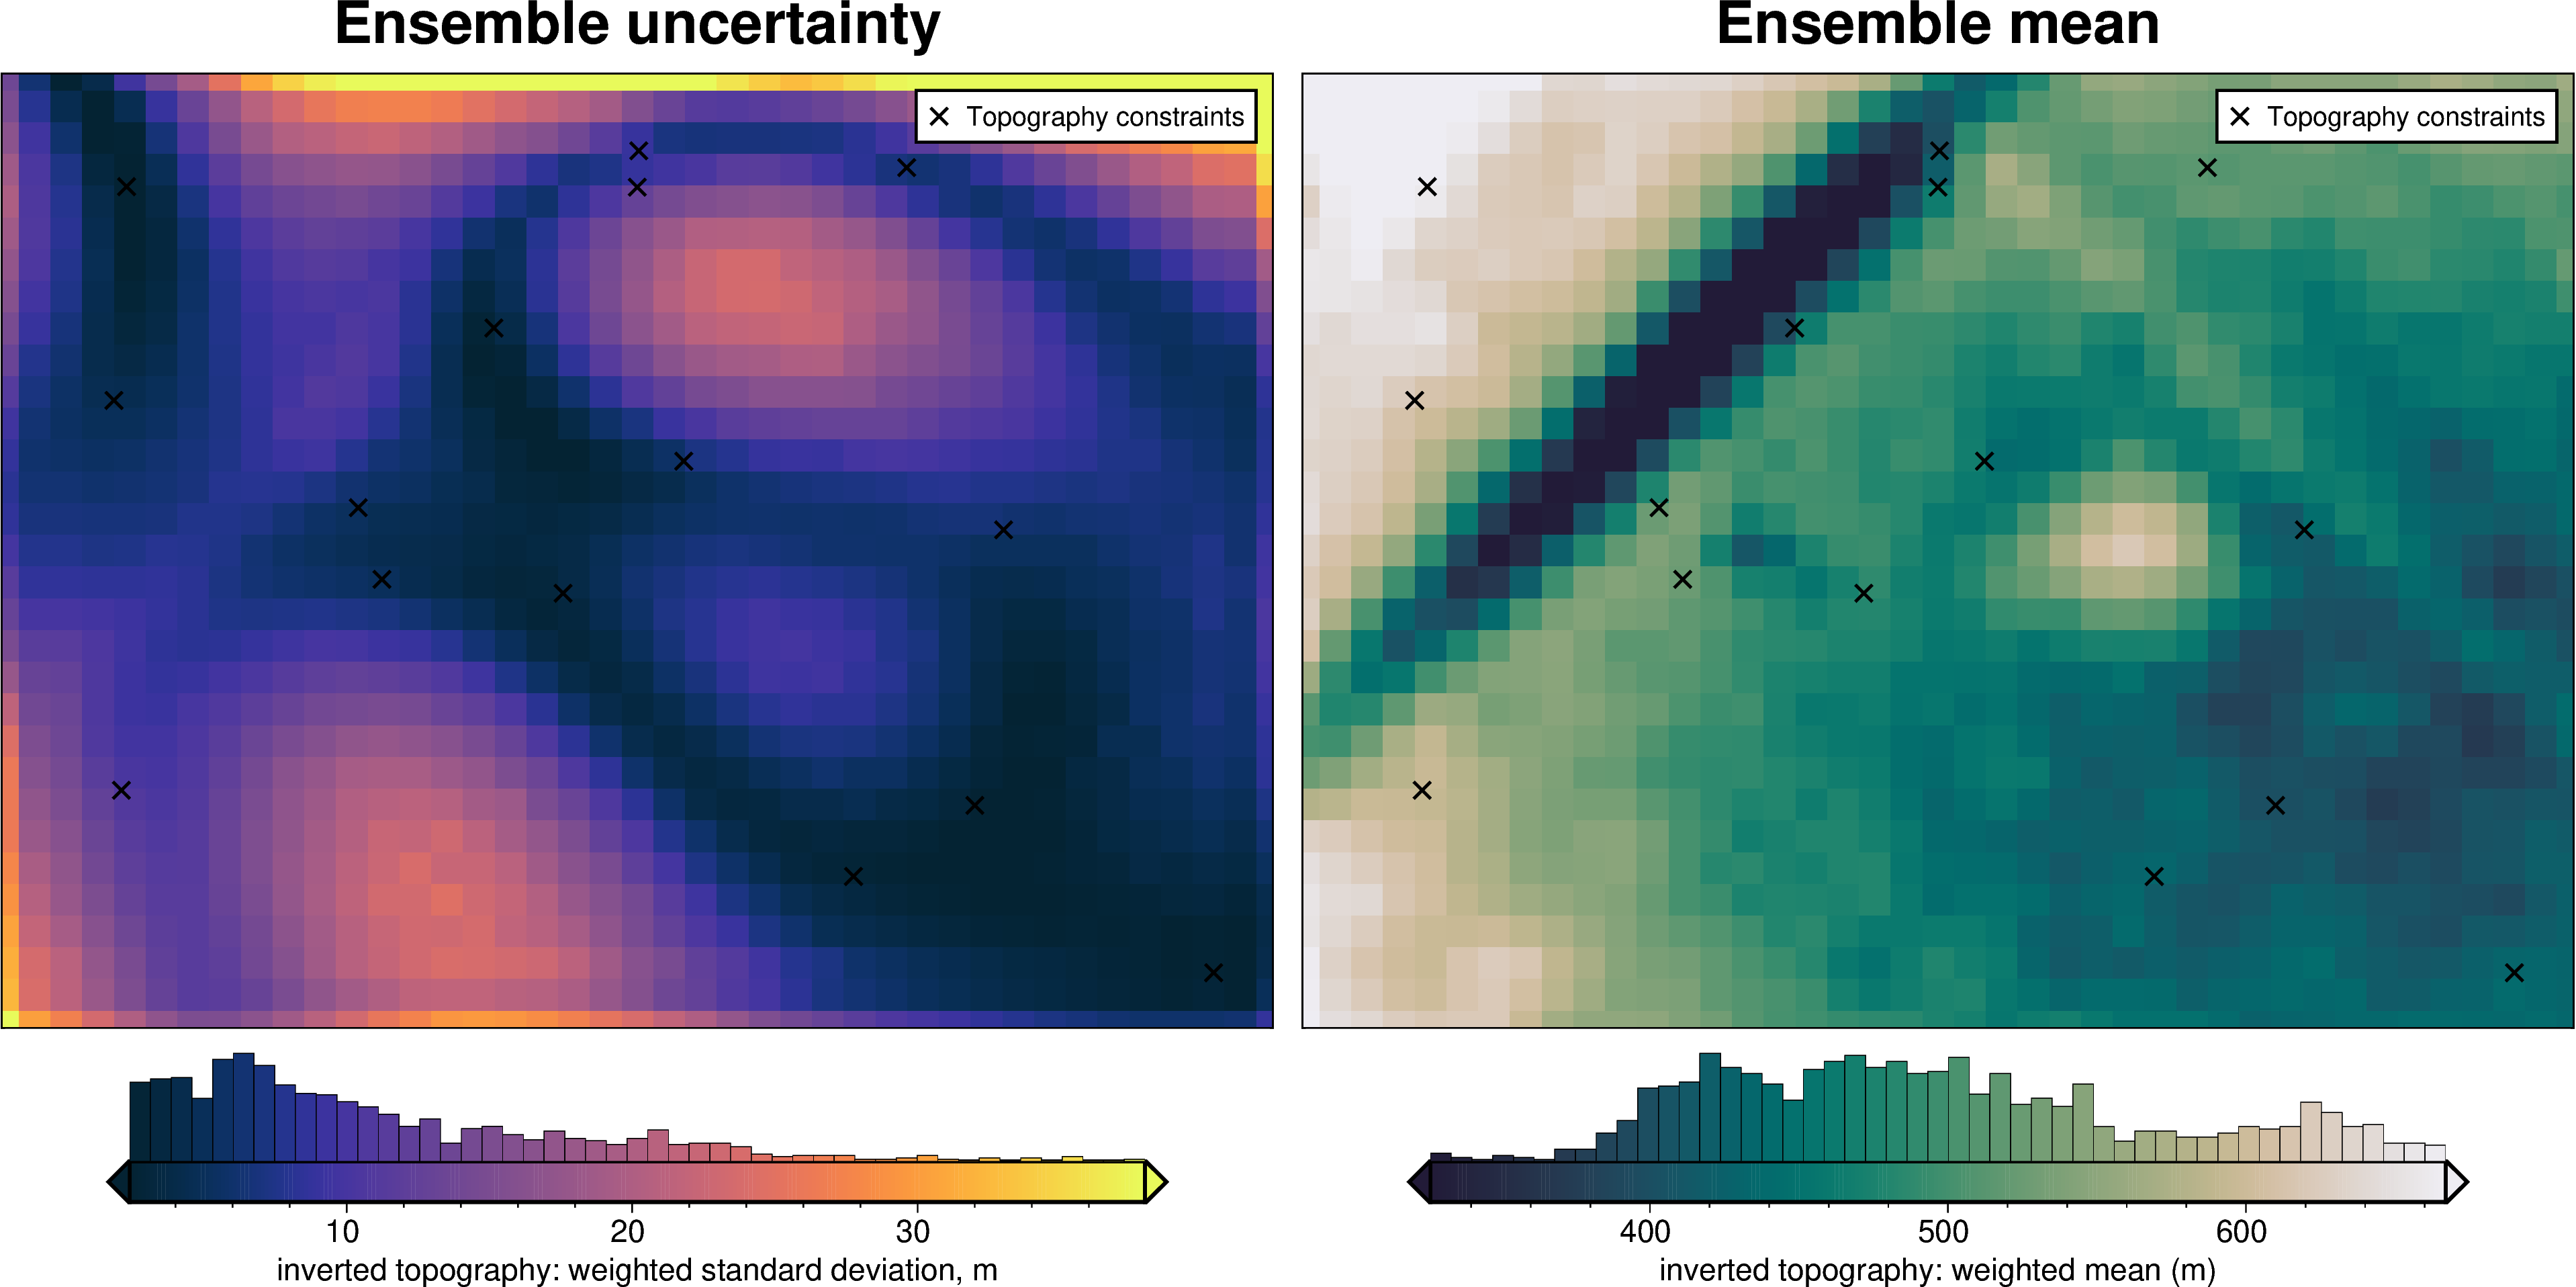
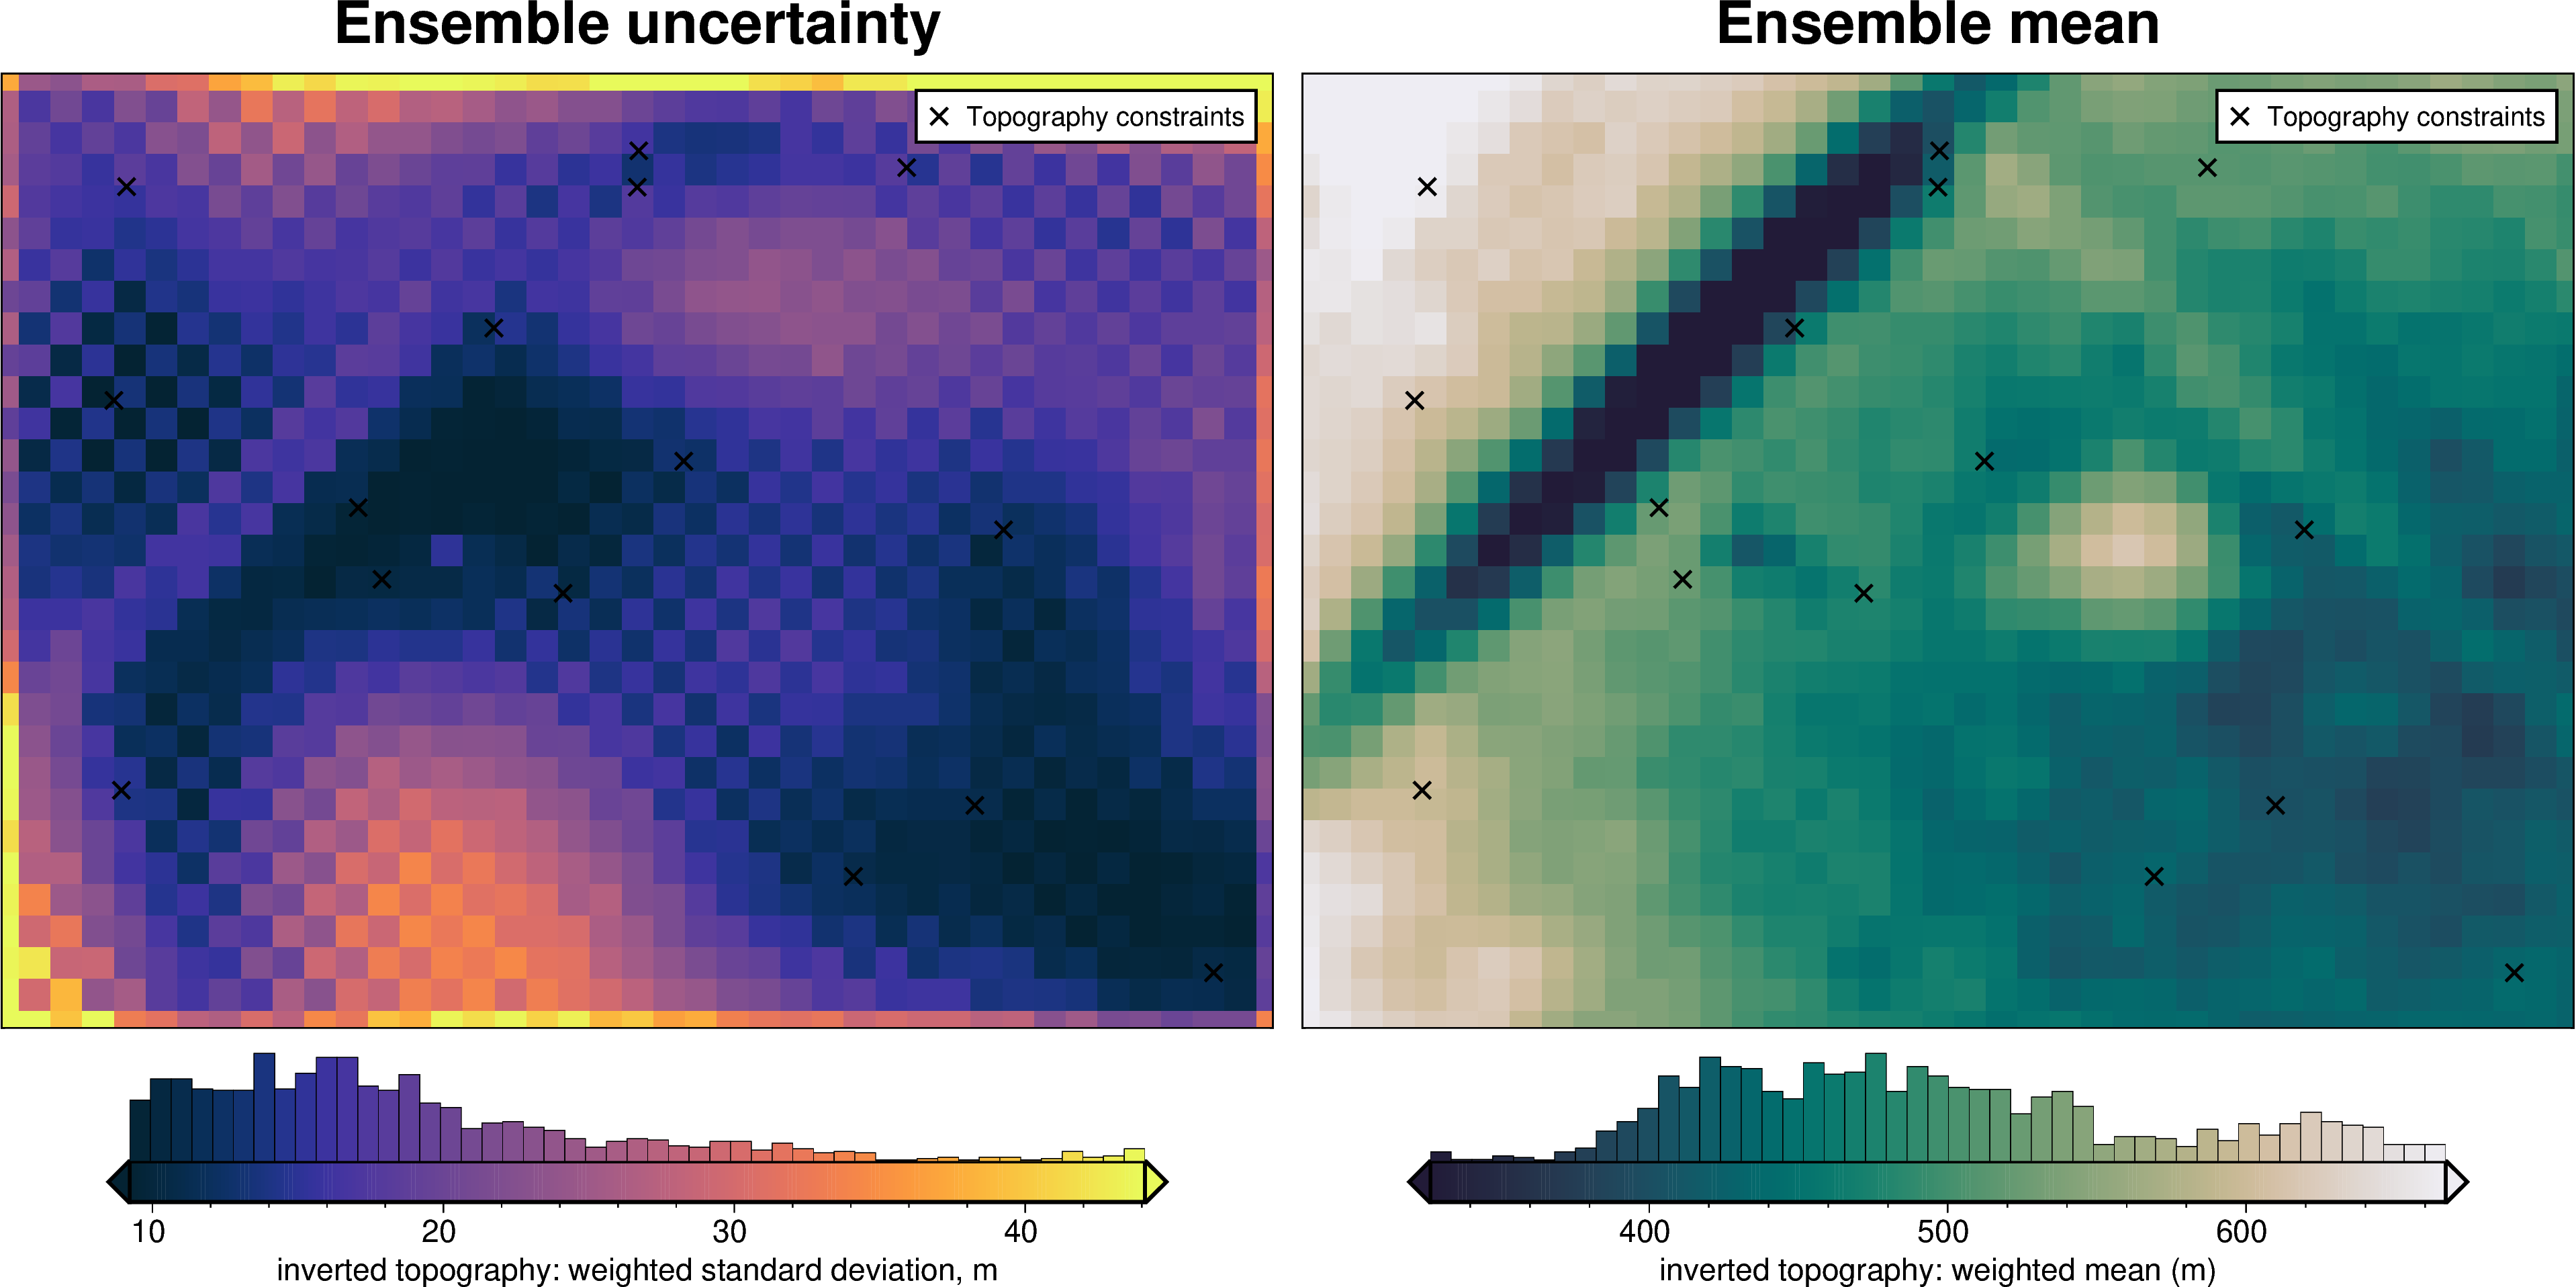
stats_ds = uncertainty.merged_stats(
results=results,
plot=True,
constraints_df=constraint_points,
weight_by=weight_by,
region=inversion_region,
)
try:
mean = stats_ds.weighted_mean
stdev = stats_ds.weighted_stdev
except AttributeError:
mean = stats_ds.z_mean
stdev = stats_ds.z_stdev
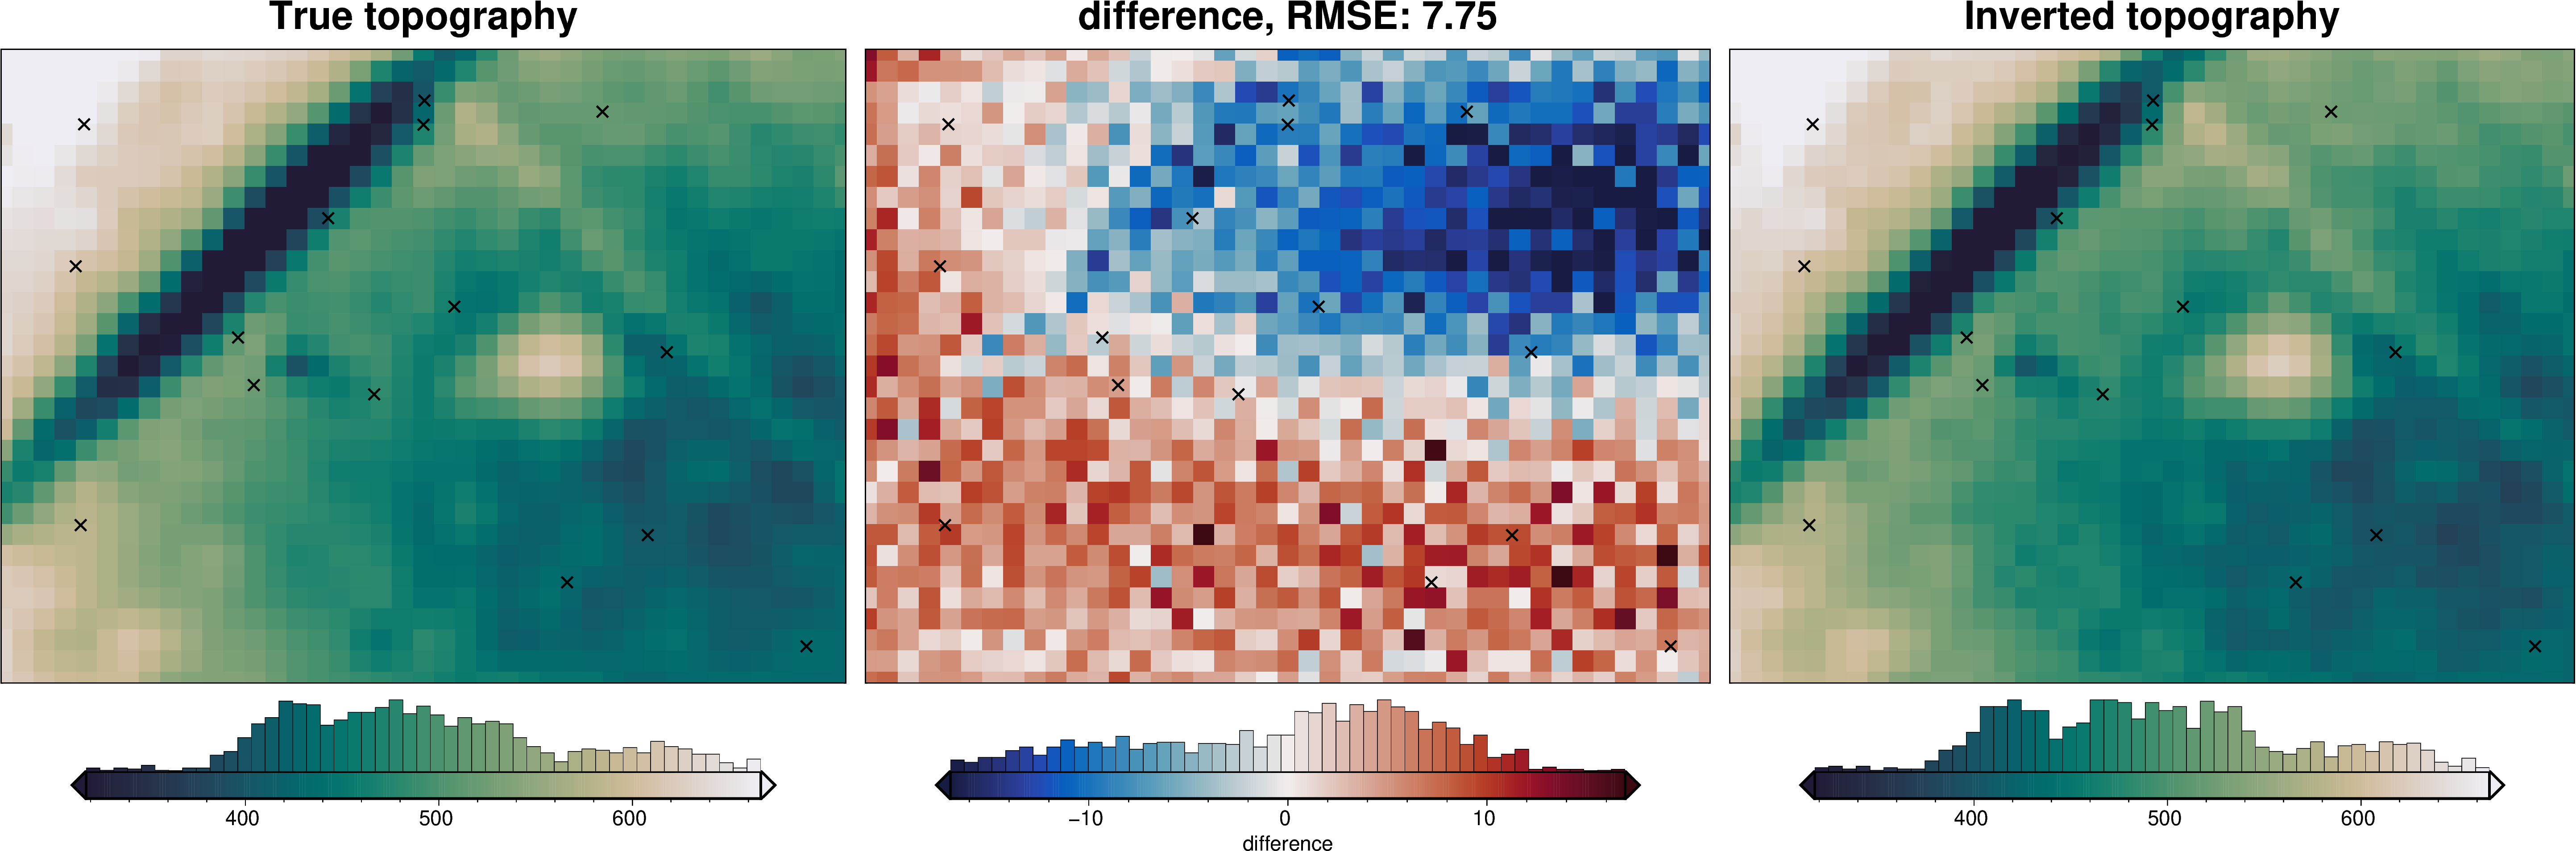
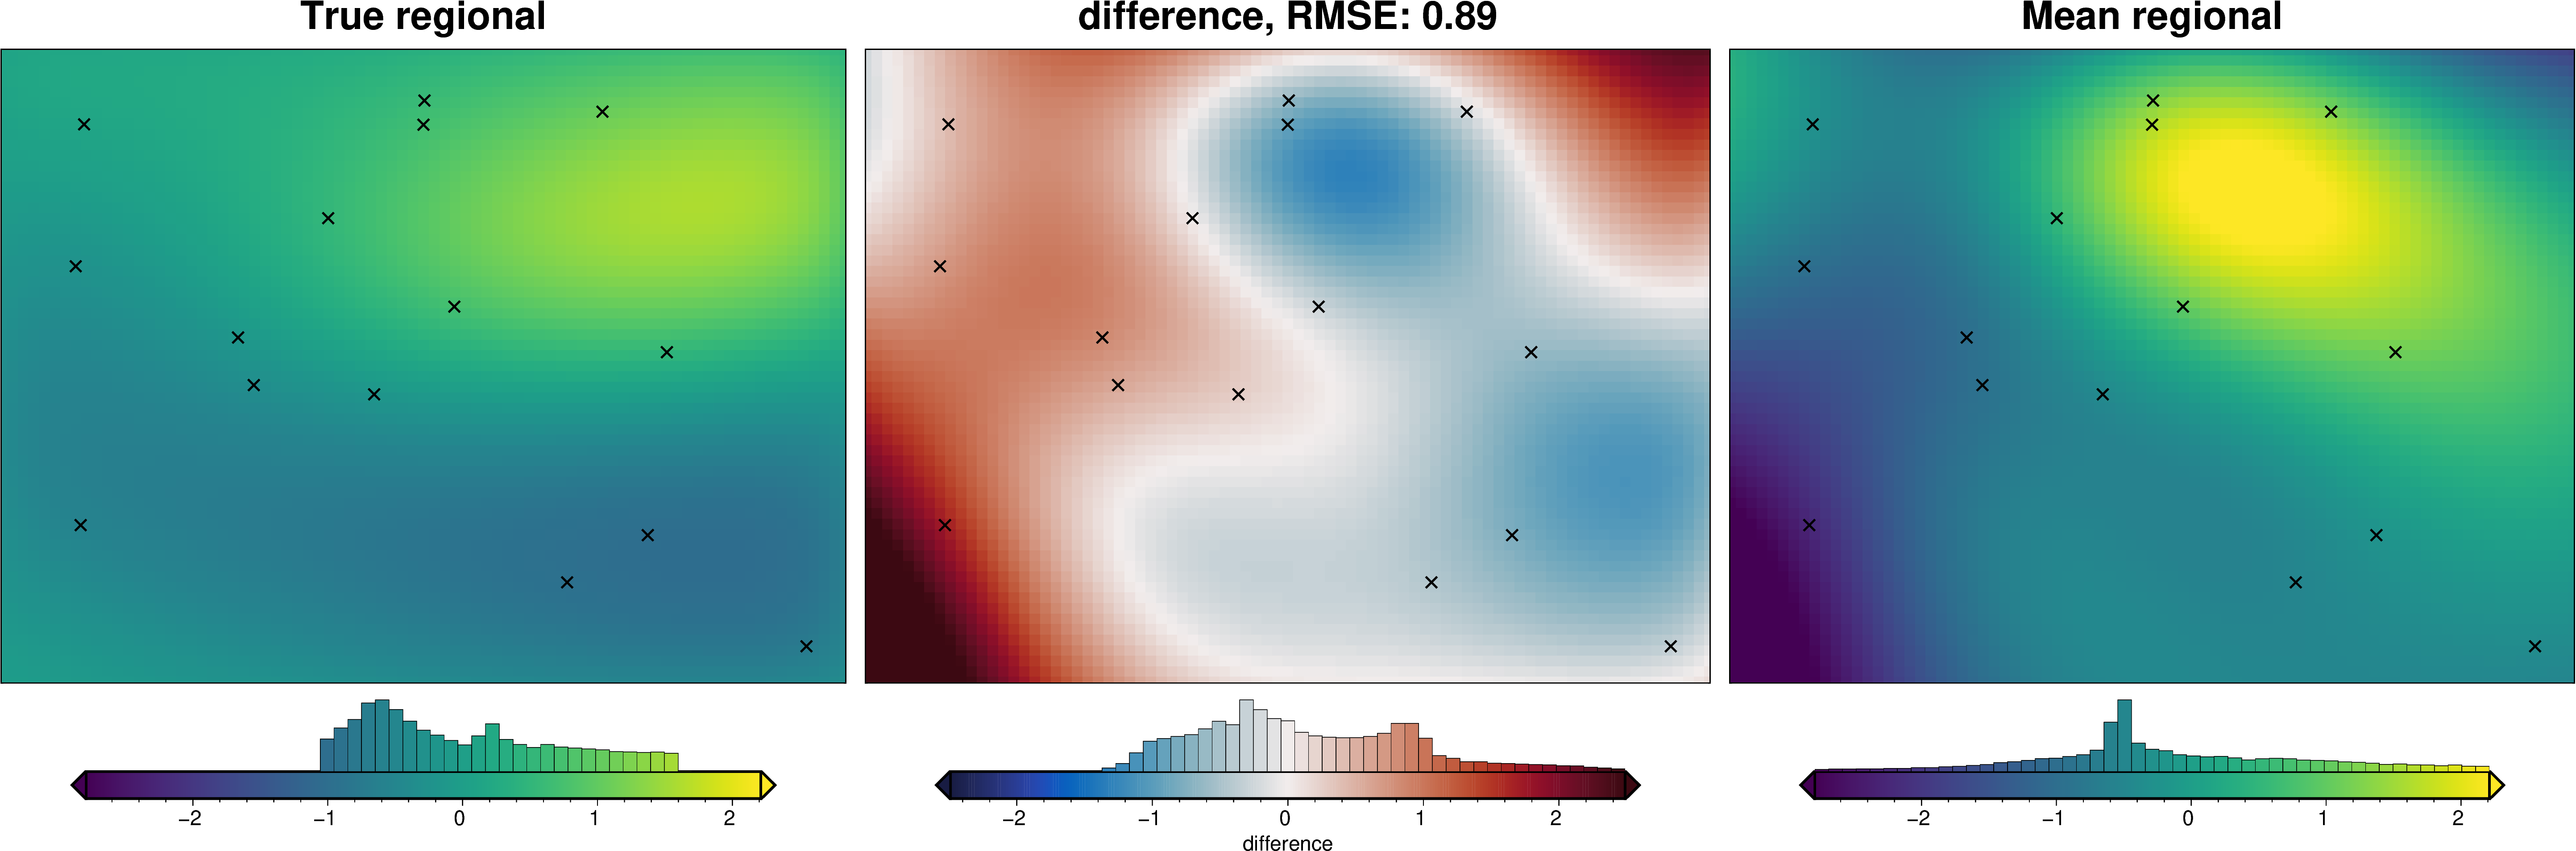
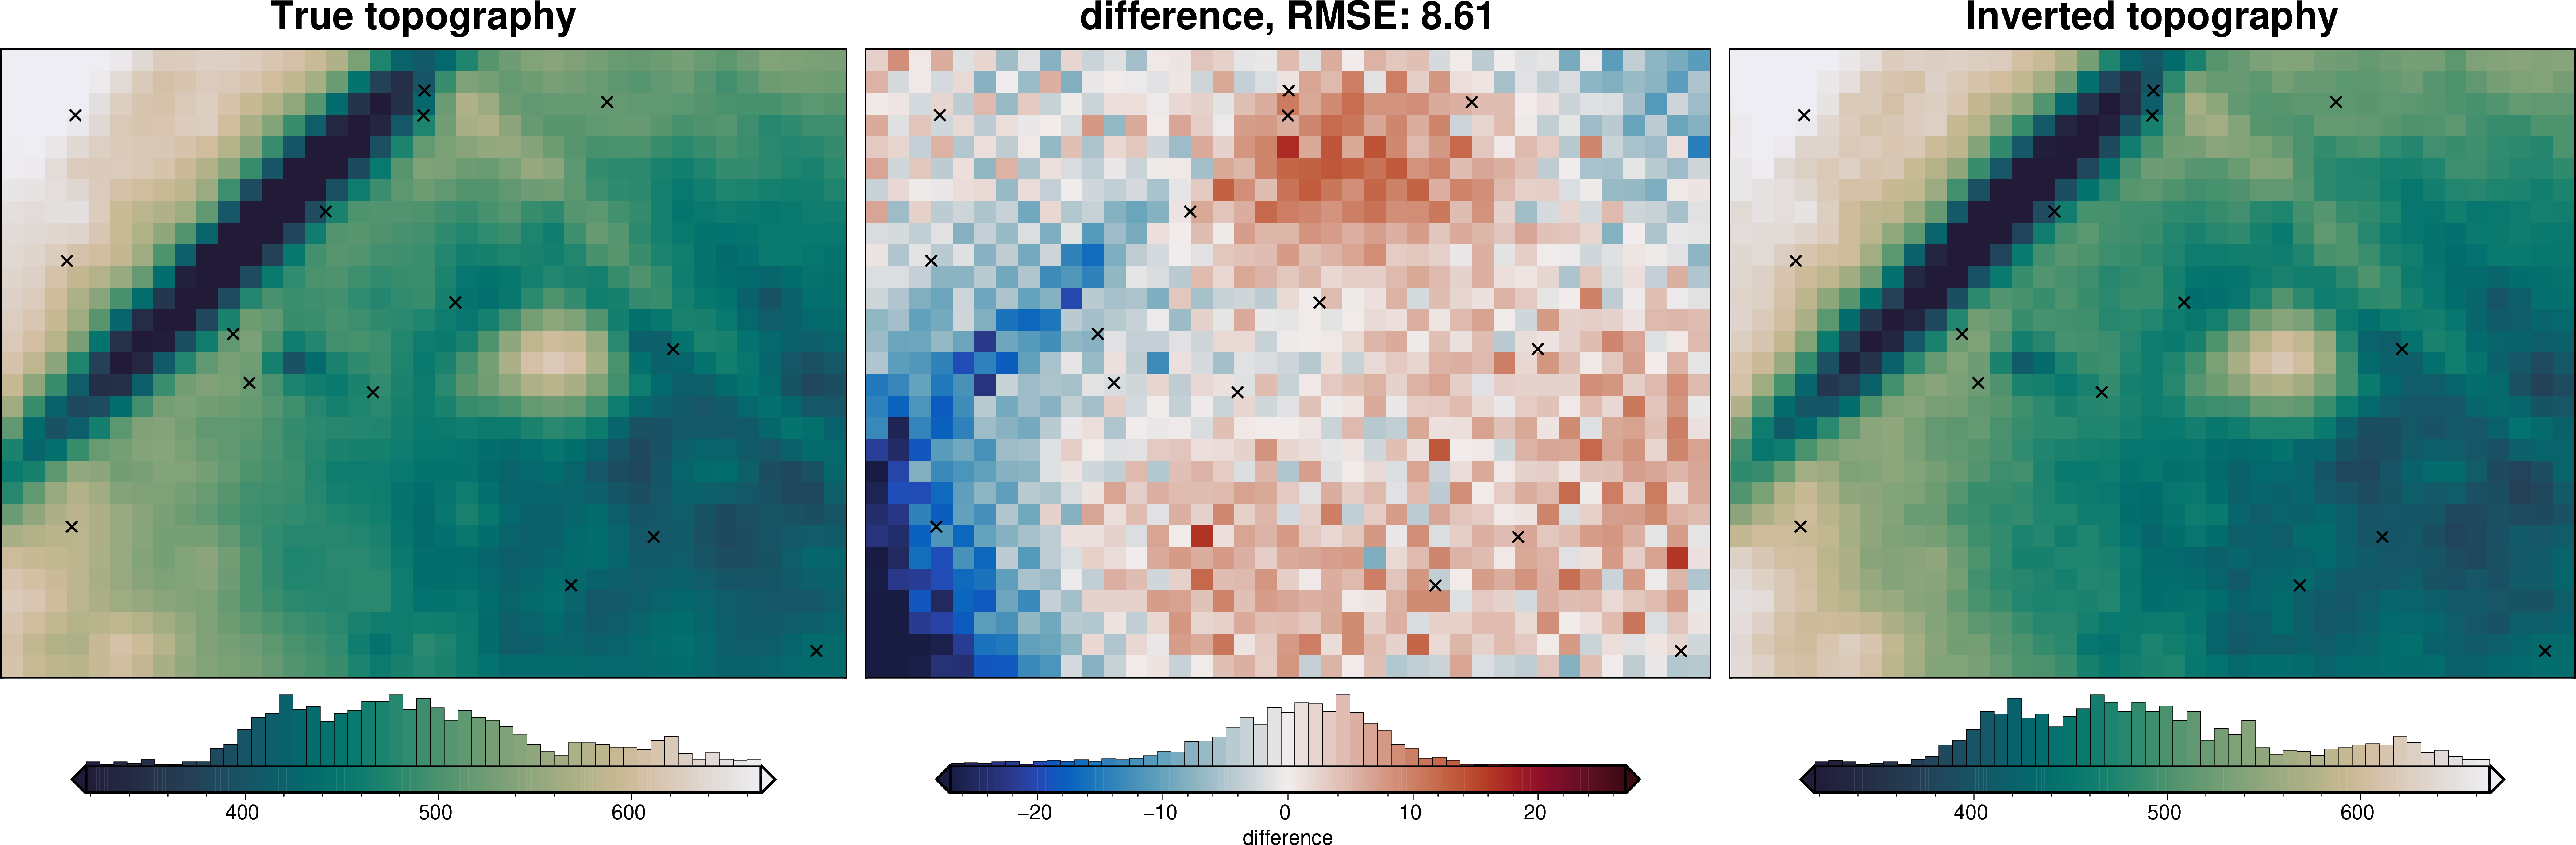
_ = polar_utils.grd_compare(
true_topography,
mean,
region=vd.pad_region(inversion_region, -spacing),
grid1_name="True topography",
grid2_name="Inverted topography",
robust=True,
hist=True,
title="difference",
grounding_line=False,
reverse_cpt=True,
cmap="rain",
points=constraint_points,
points_style="x.3c",
)
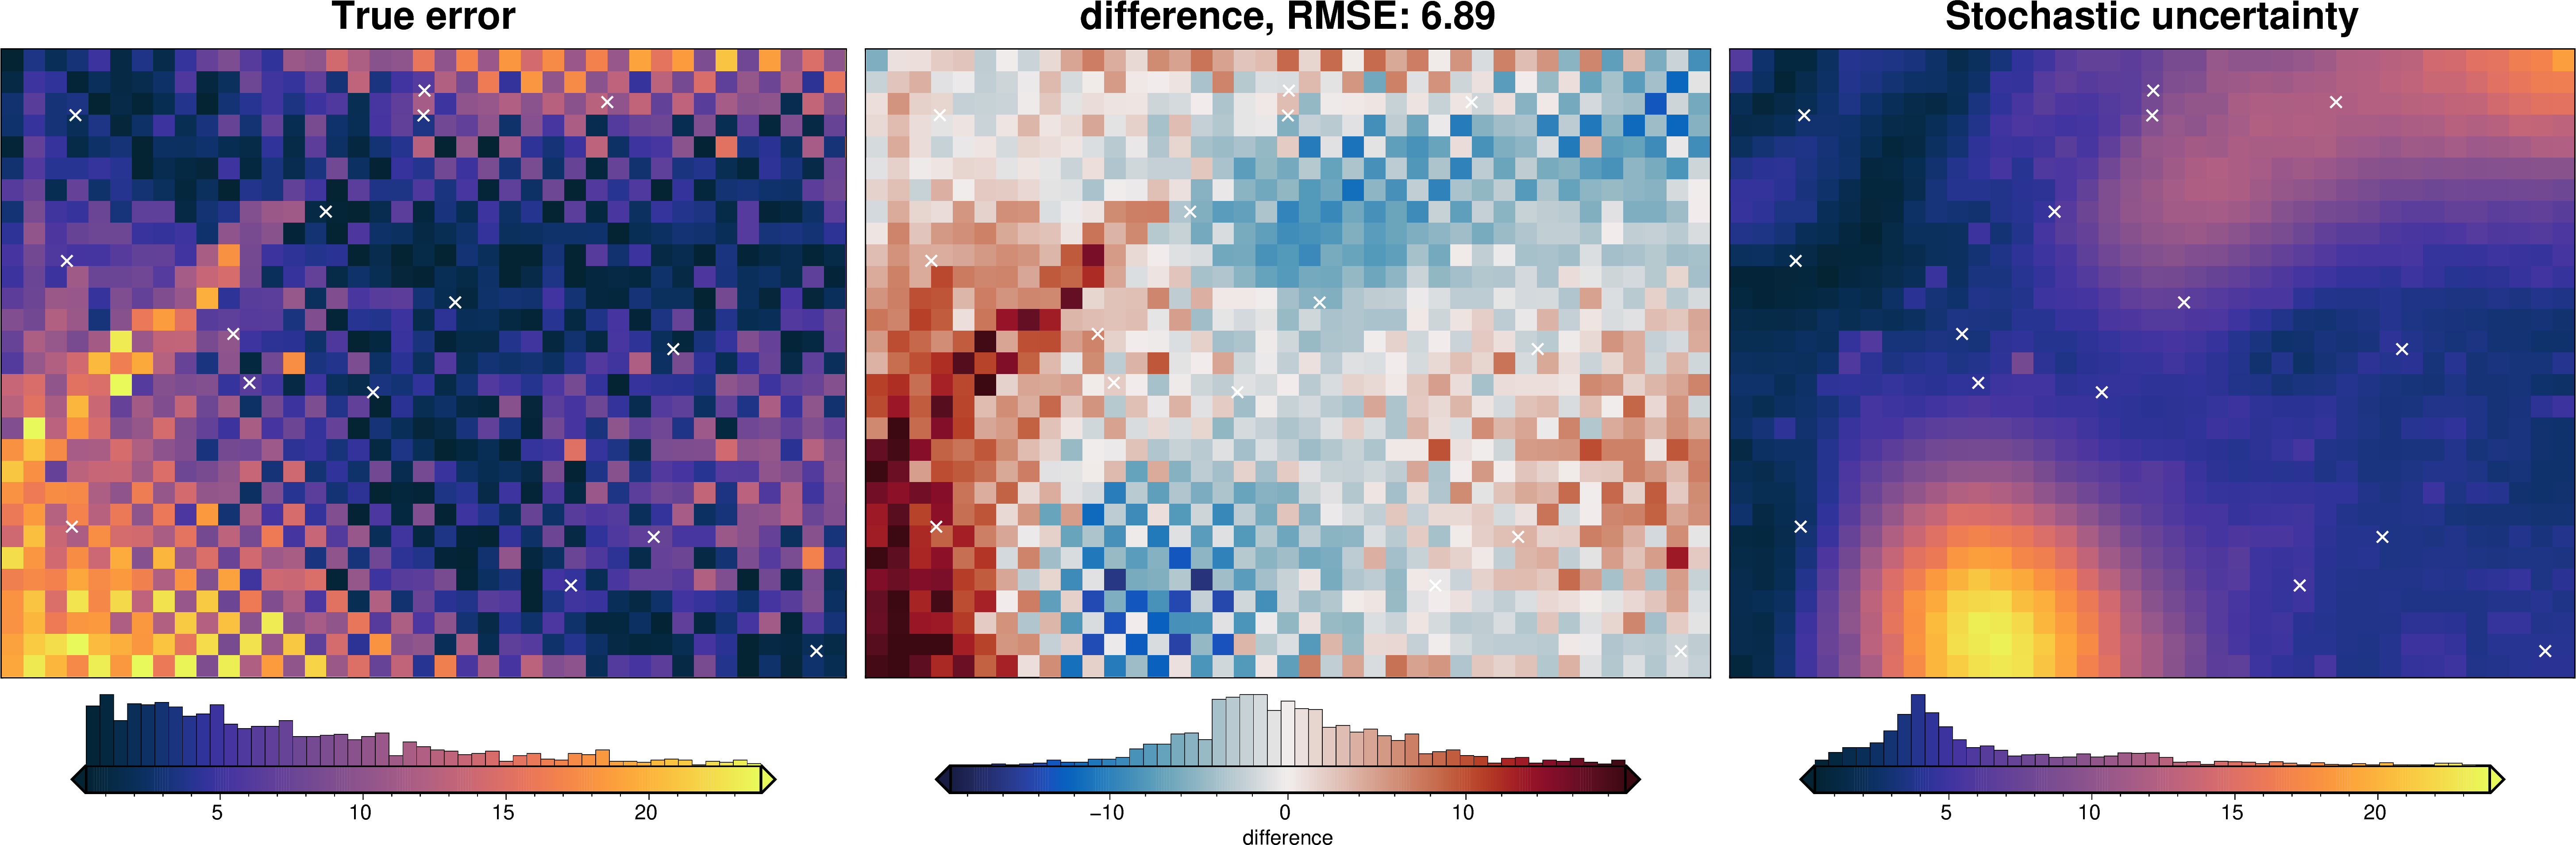
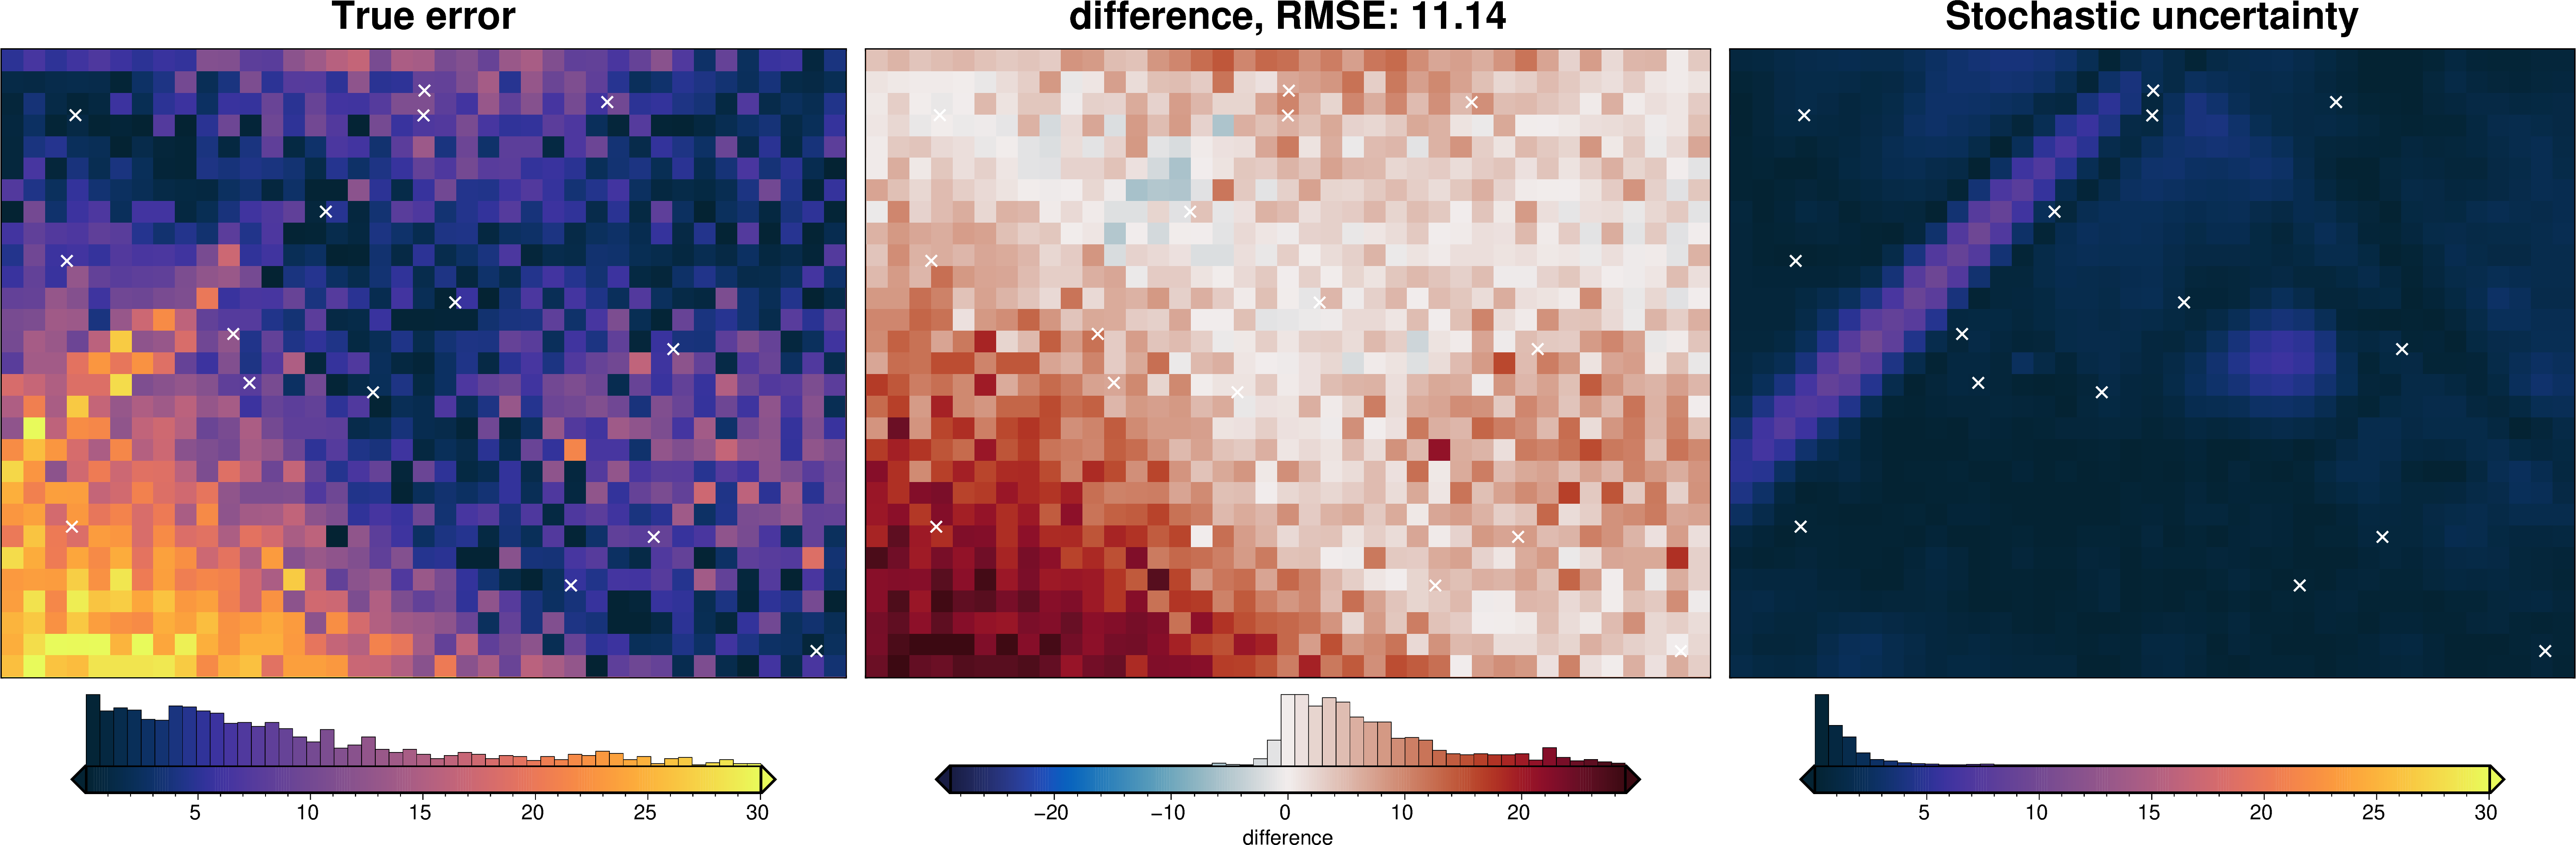
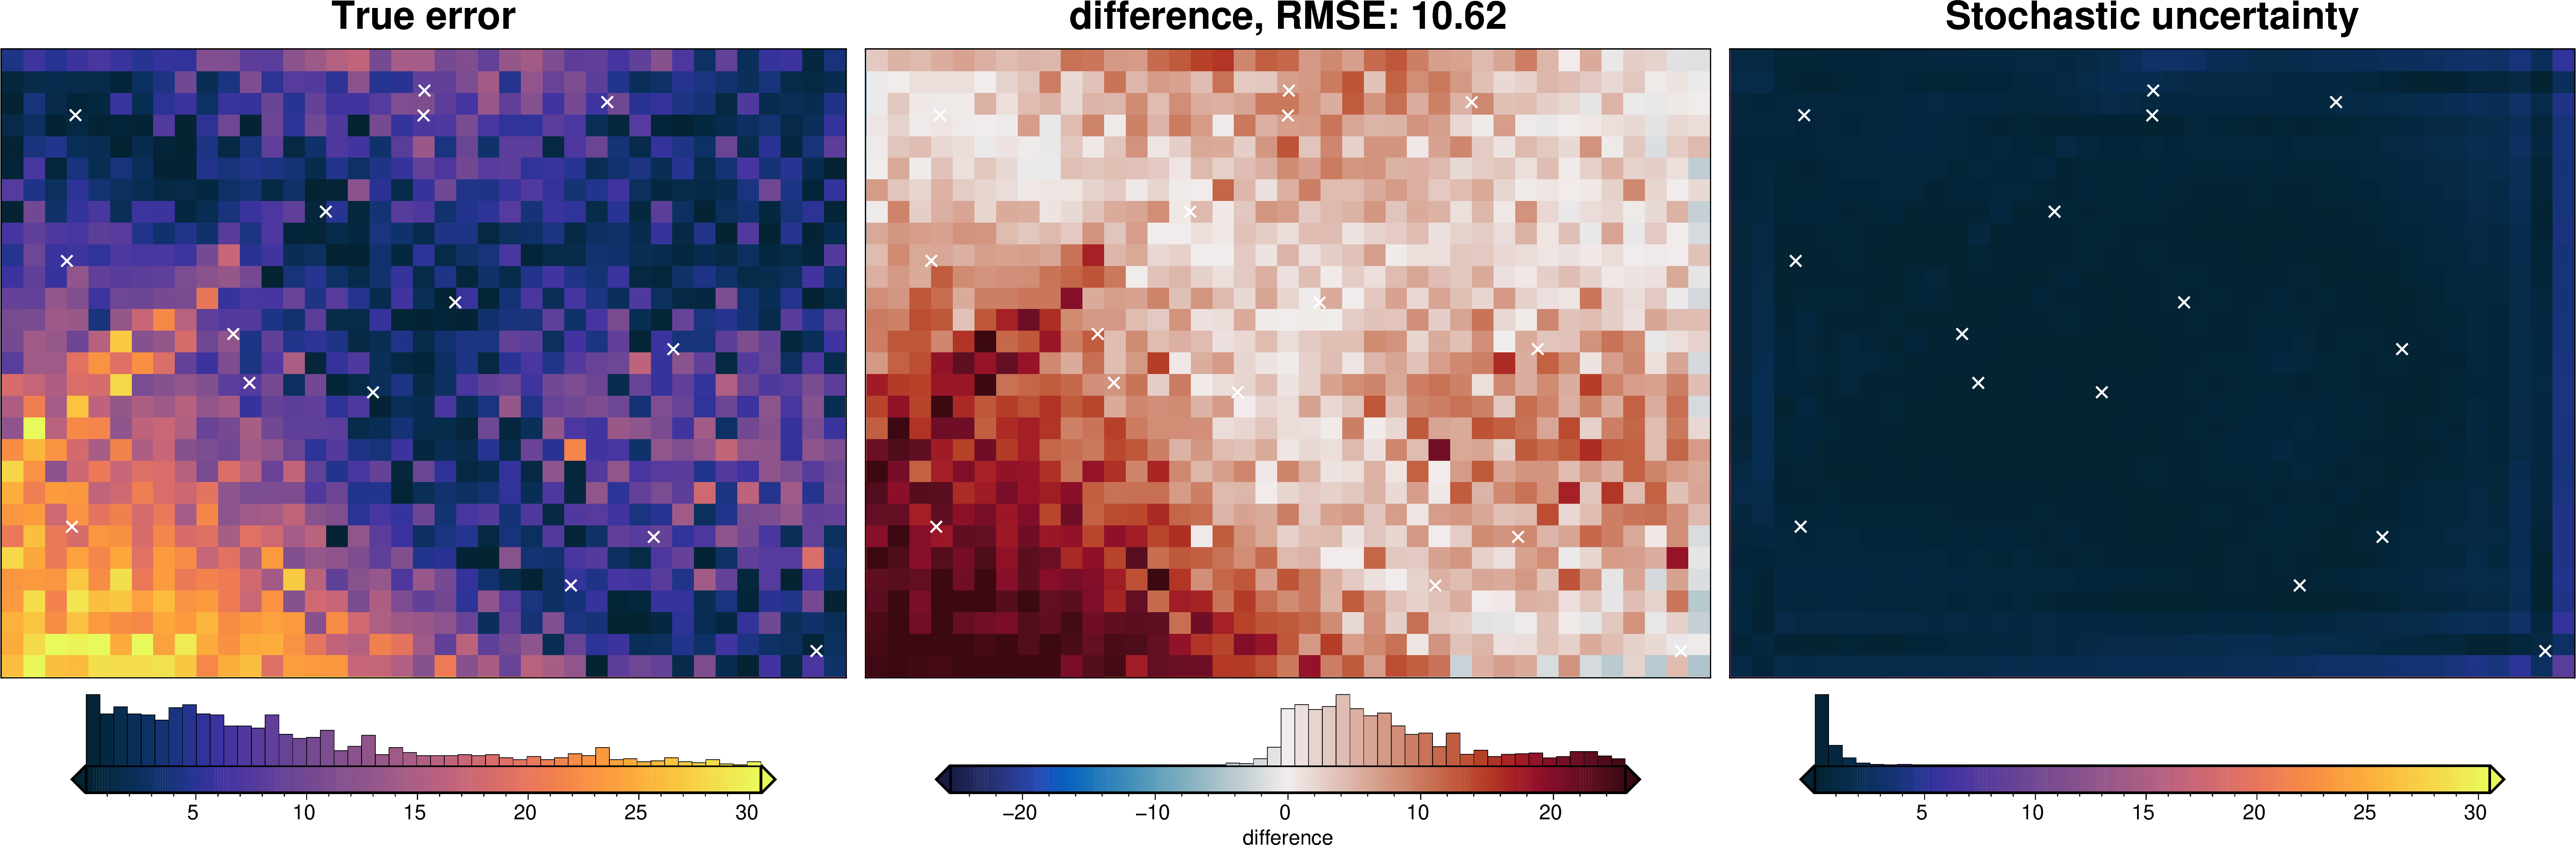
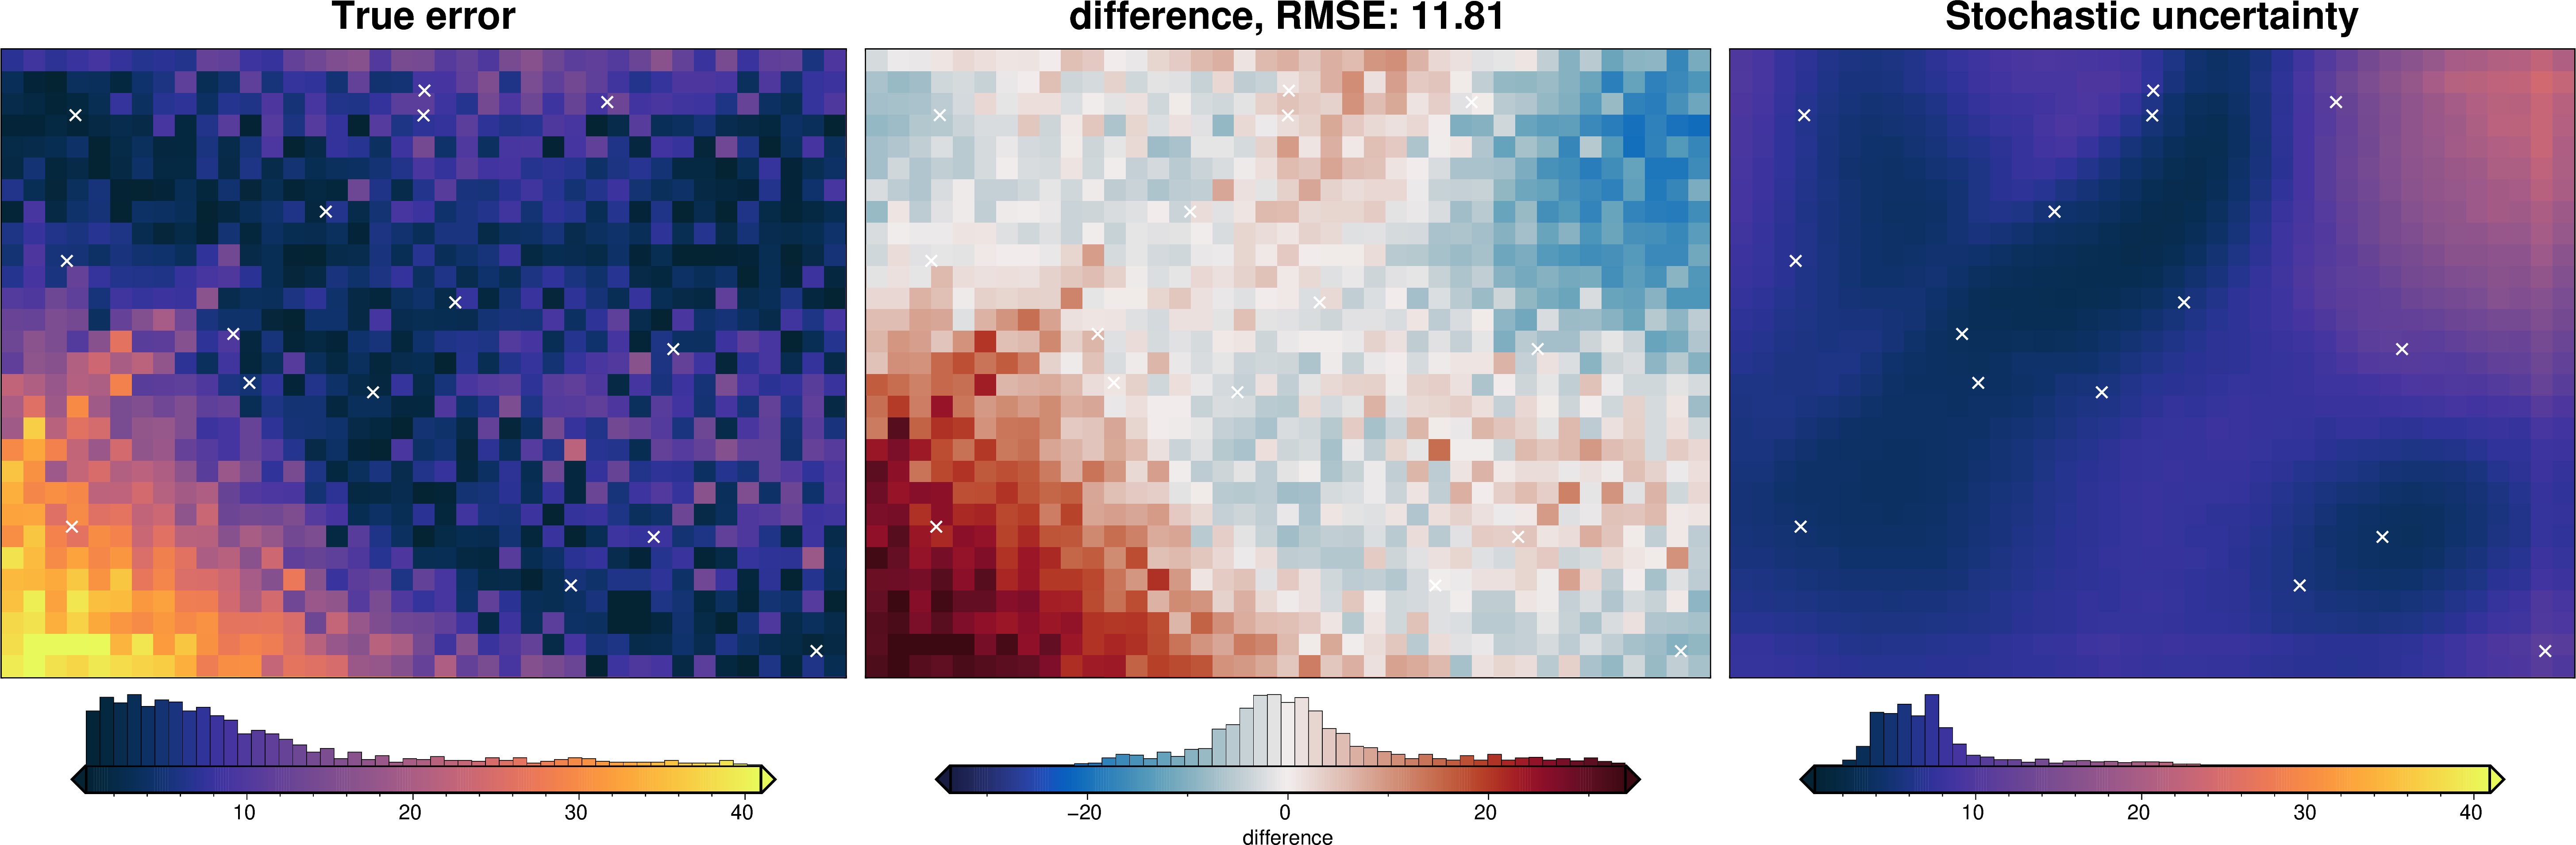
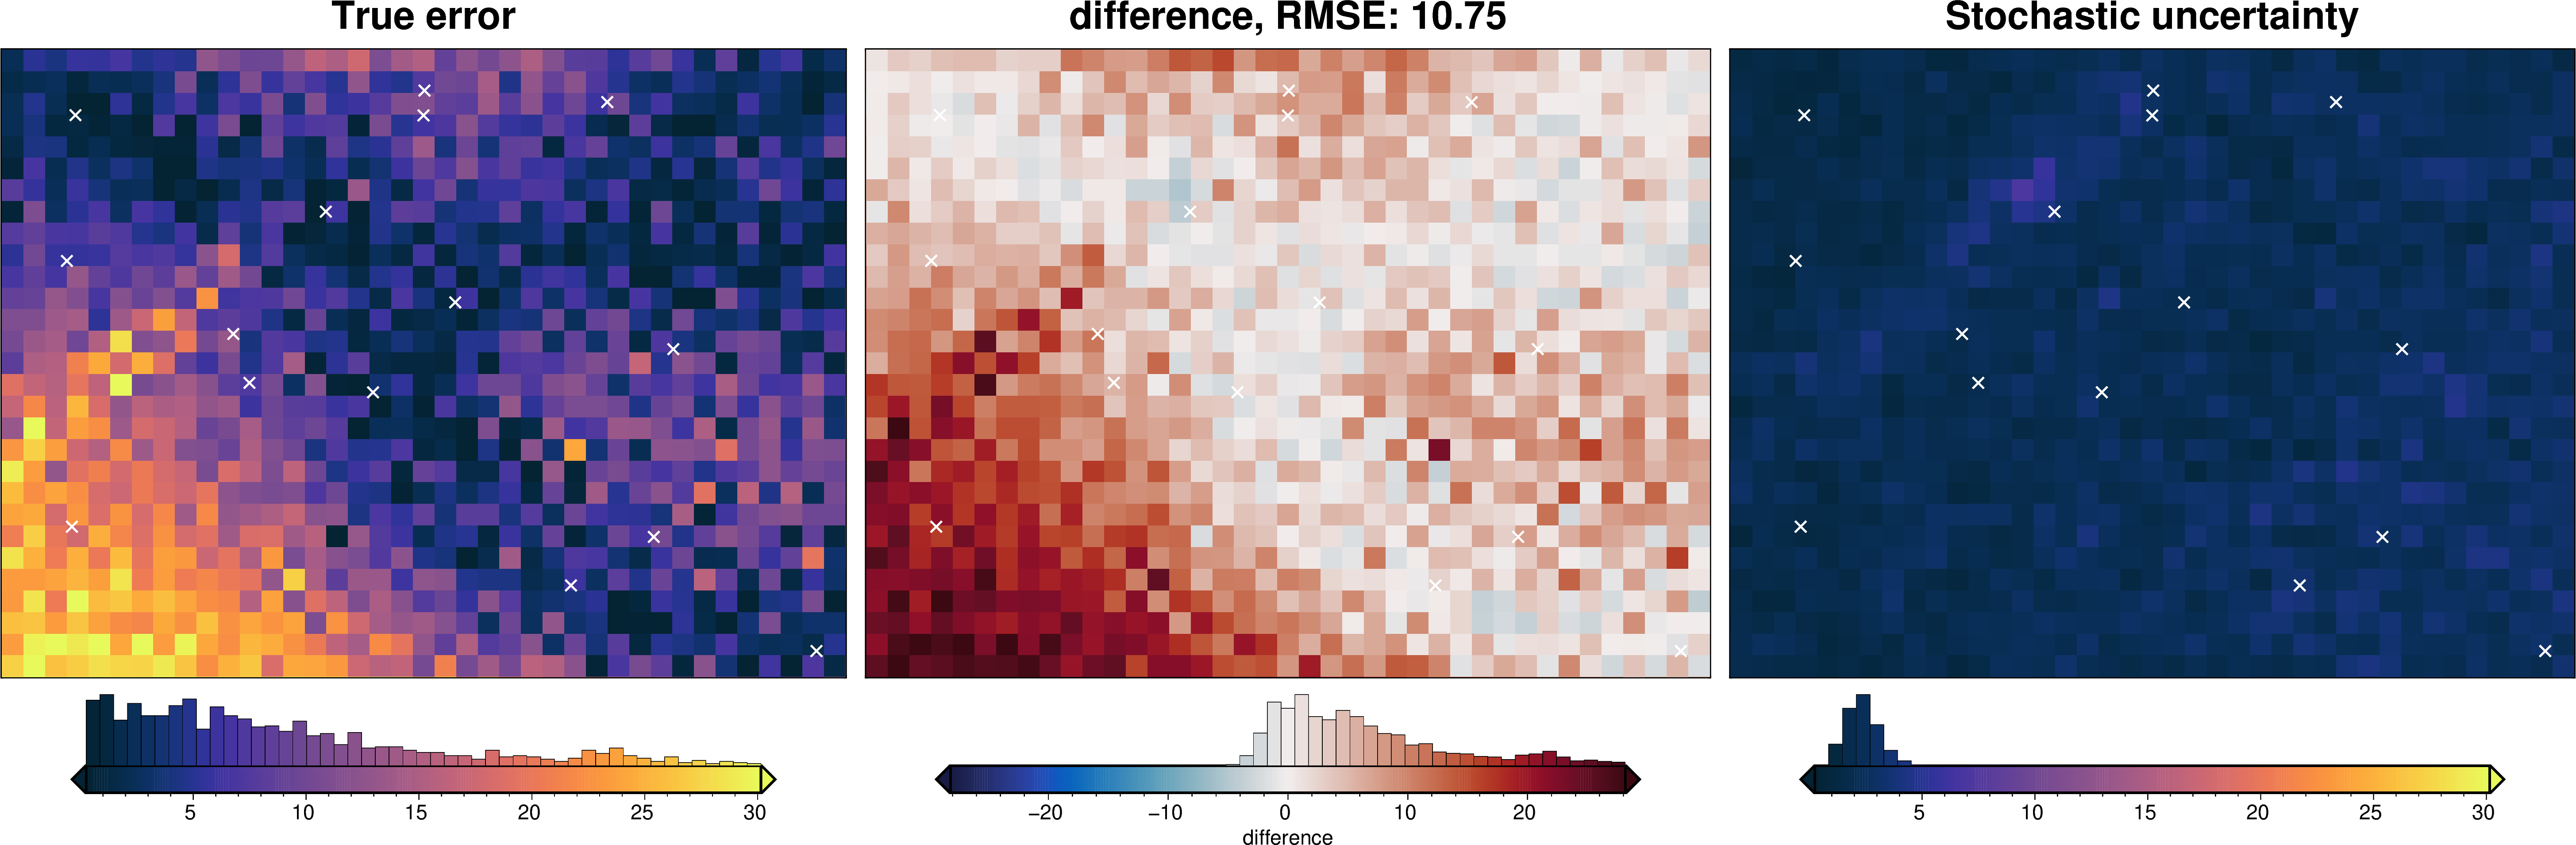
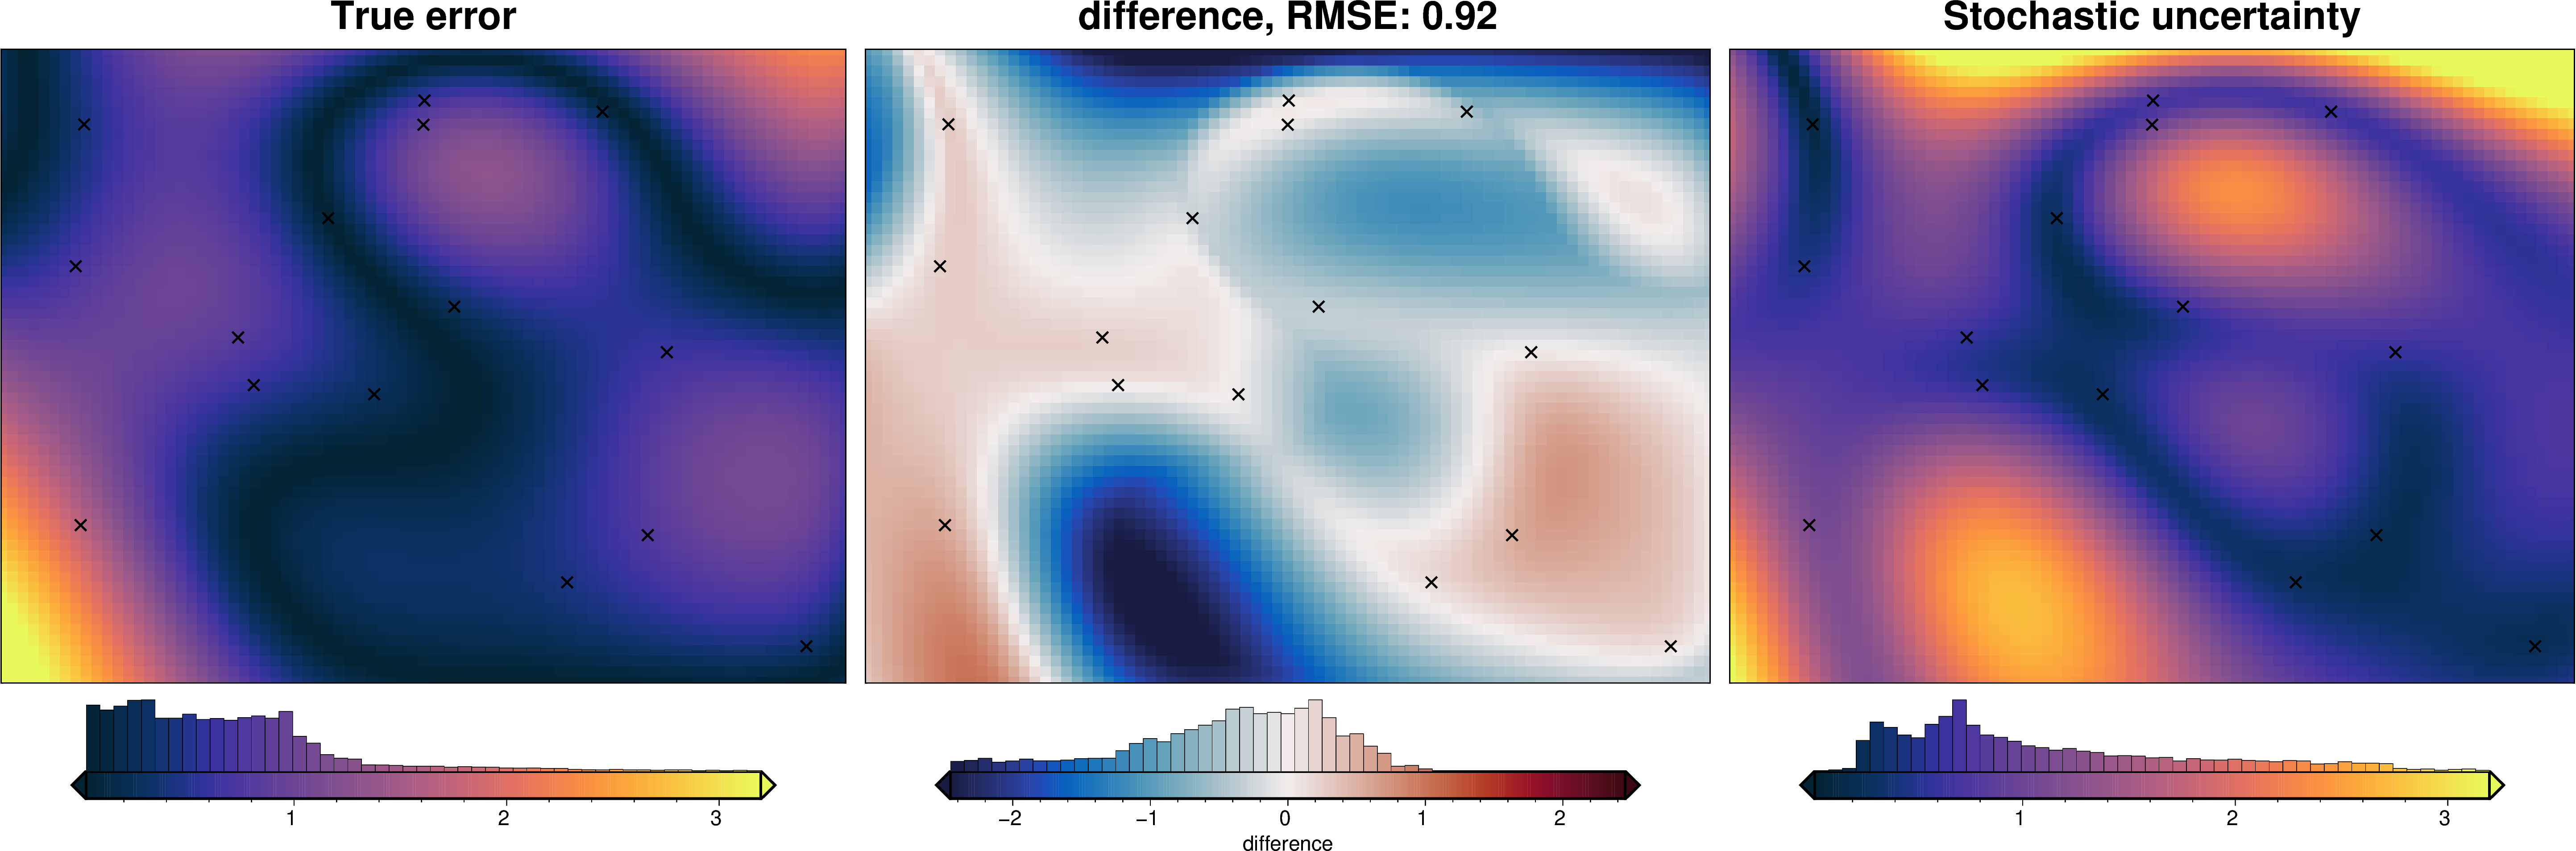
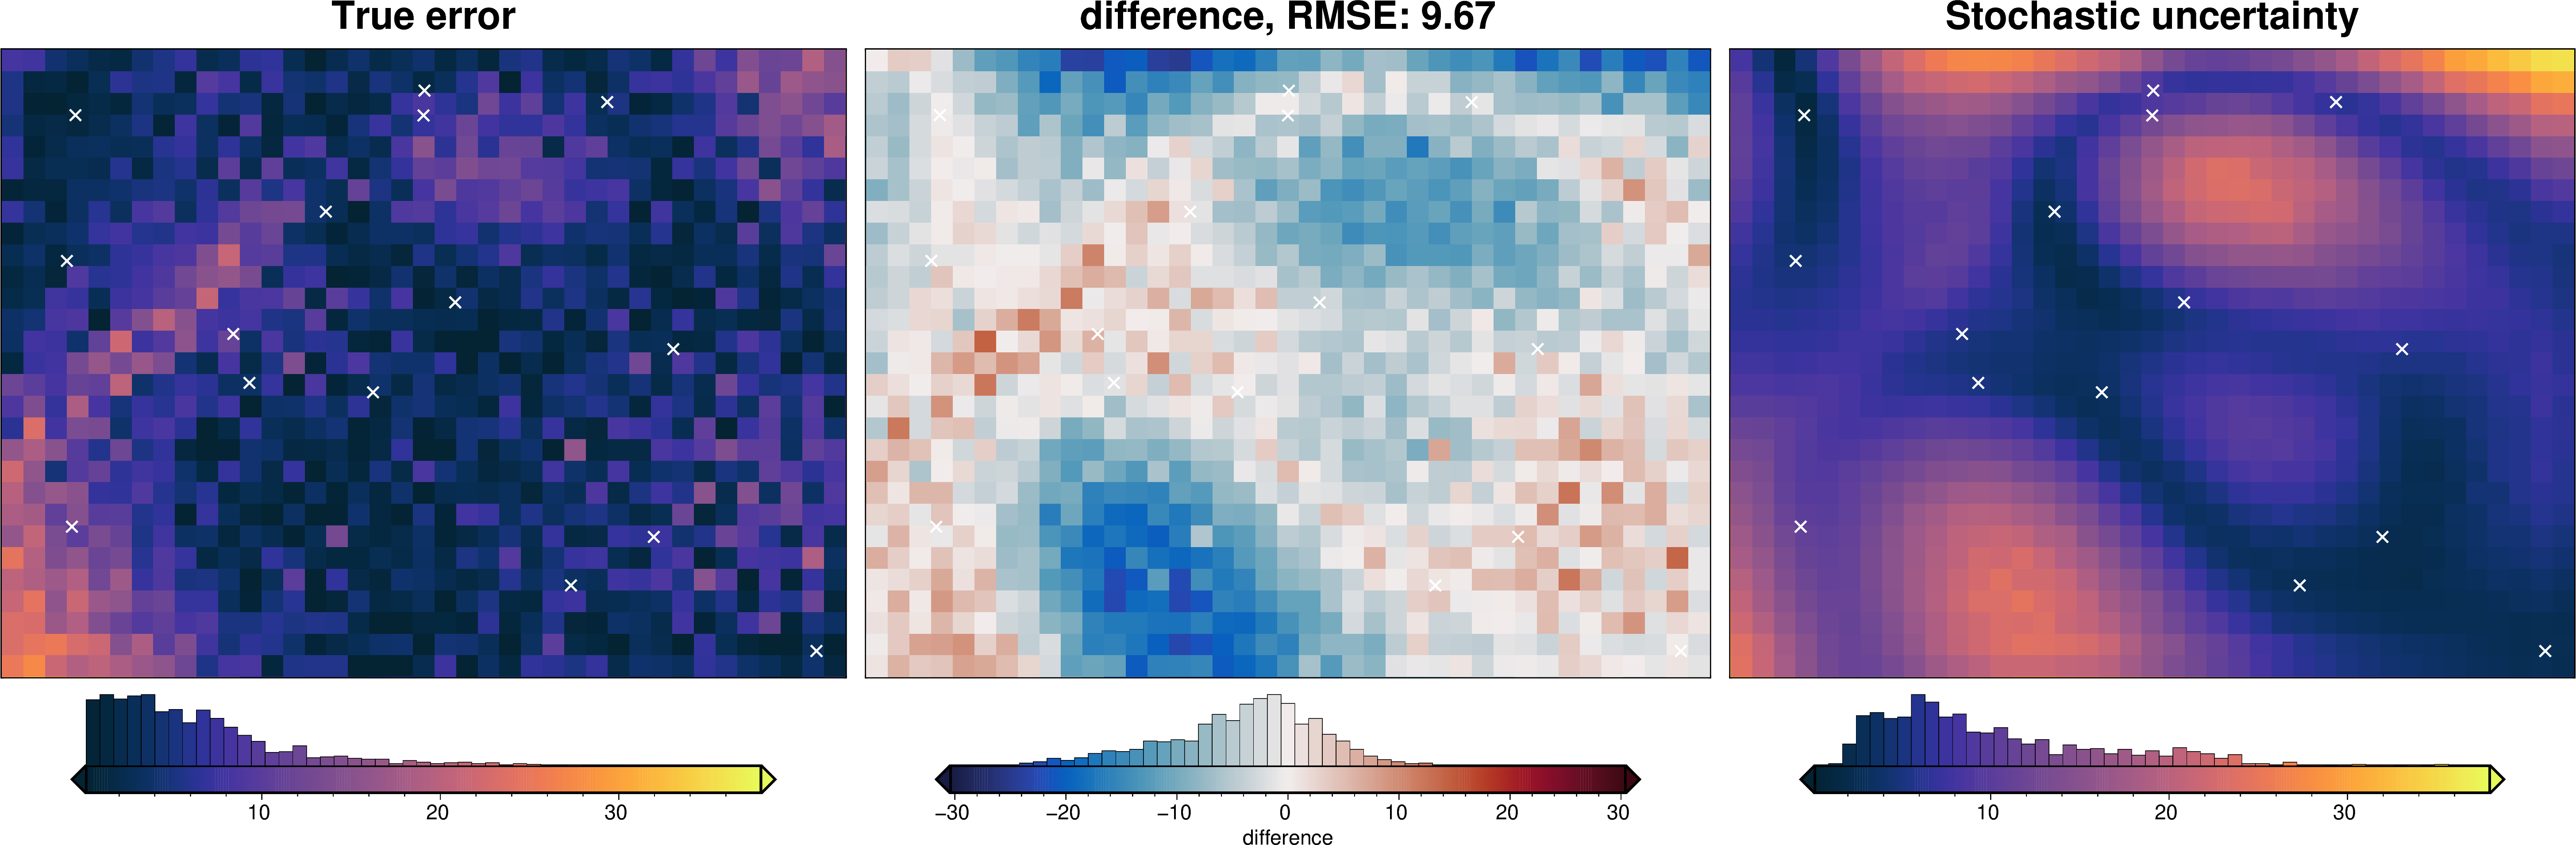
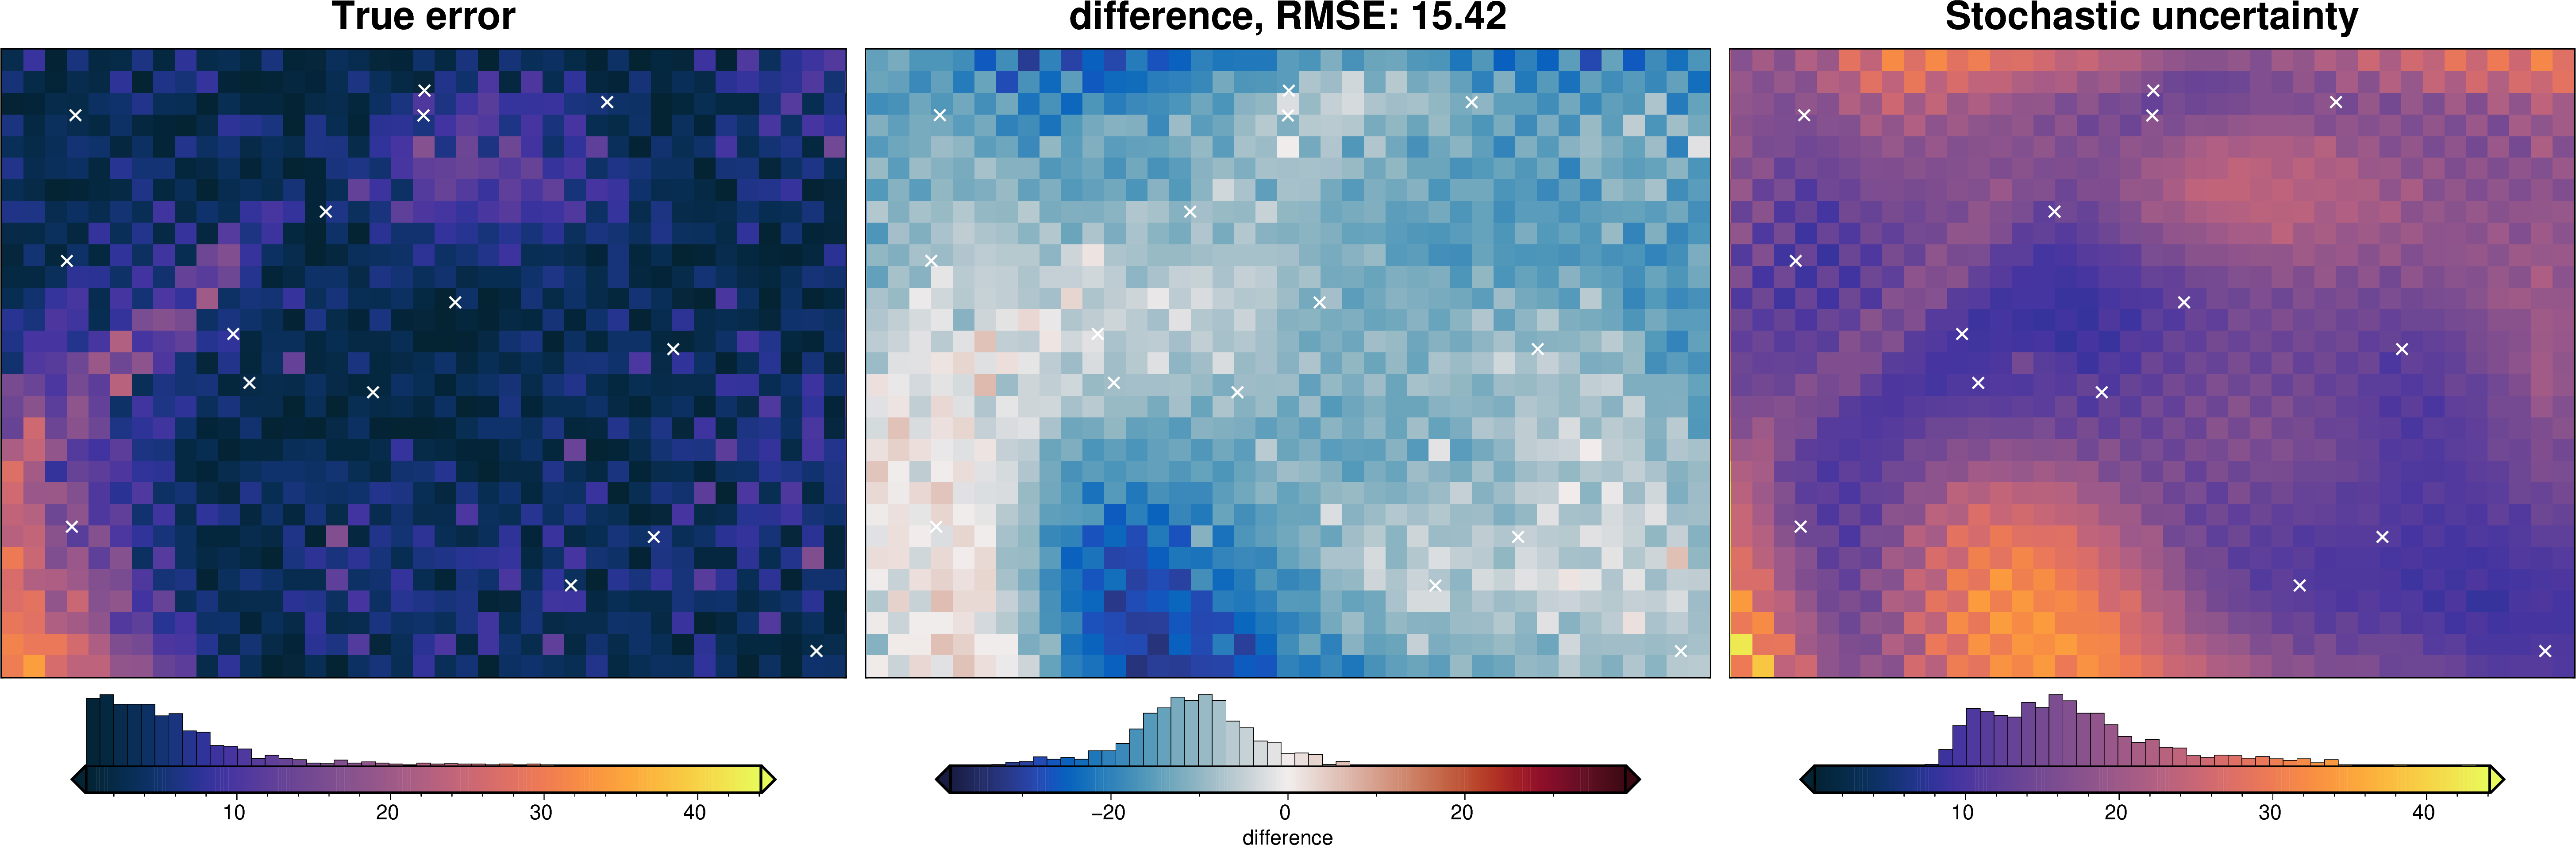
_ = polar_utils.grd_compare(
np.abs(true_topography - mean),
stdev,
region=vd.pad_region(inversion_region, -spacing),
grid1_name="True error",
grid2_name="Stochastic uncertainty",
cmap="thermal",
robust=True,
hist=True,
title="difference",
grounding_line=False,
points=constraint_points,
points_style="x.3c",
points_fill="white",
)
return stats_ds
14. Uncertainty analysis#
[16]:
# get mean spacing between nearest constraints
mean_spacing = np.mean(
    vd.median_distance(
        (constraint_points.easting, constraint_points.northing),
        k_nearest=1,
    )
)
mean_spacing
[16]:
np.float64(5599.156508868462)
[17]:
# use optimal eq source parameters for regional separation in uncertainty analysis
# re-load the study from the saved pickle file
with pathlib.Path(f"{regional_grav_kwargs.get('cv_kwargs').get('fname')}.pickle").open(
    "rb"
) as f:
    study = pickle.load(f)
reg_eq_damping = min(study.best_trials, key=lambda t: t.values[0]).params["damping"]

reg_eq_depth = 4.5 * mean_spacing

new_regional_grav_kwargs = dict(
    method="constraints",
    grid_method="eq_sources",
    constraints_df=constraint_points,
    damping=reg_eq_damping,
    depth=reg_eq_depth,
    block_size=None,
)
reg_eq_damping, reg_eq_depth
[17]:
(0.04881091466863527, np.float64(25196.204289908077))
[18]:
# add best damping parameter to kwargs
kwargs["solver_damping"] = solver_damping

# kwargs to reuse for all uncertainty analyses
uncert_kwargs = dict(
    grav_df=grav_df,
    density_contrast=density_contrast,
    zref=zref,
    starting_prisms=starting_prisms,
    starting_topography=starting_topography,
    regional_grav_kwargs=new_regional_grav_kwargs,
    **kwargs,
)
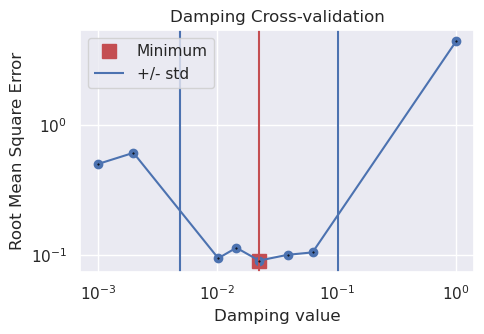
14.1. Solver damping component#
To estimate the uncertainty of the choice of solver damping value, we will load the damping cross validation and calculate the standard deviation of the trials (excluding outliers)
[19]:
# load study
with pathlib.Path("../tmp/combining_it_all_damping_CV_study.pickle").open("rb") as f:
    study = pickle.load(f)

study_df = study.trials_dataframe().drop(columns=["user_attrs_results"])
study_df.sort_values("value", inplace=True)  # noqa: PD002

# calculate zscores of values
study_df["value_zscore"] = sp.stats.zscore(study_df["value"])

# drop outliers (values with zscore > |2|)
study_df2 = study_df[(np.abs(study_df.value_zscore) < 2)]

# pick damping standard deviation based on optimization
stdev = np.log10(study_df2.params_damping).std()
print(f"calculated stdev: {stdev}")
# stdev = .1
print(f"using stdev: {stdev}")
calculated stdev: 0.6606916434963407
using stdev: 0.6606916434963407
[20]:
fig = plotting.plot_cv_scores(
    study_df.value,
    study_df.params_damping,
    param_name="Damping",
    logx=True,
    logy=True,
)
ax = fig.axes[0]

best = float(study_df2.params_damping.iloc[0])
upper = float(10 ** (np.log10(best) + stdev))
lower = float(10 ** (np.log10(best) - stdev))

y_lims = ax.get_ylim()
ax.vlines(best, ymin=y_lims[0], ymax=y_lims[1], color="r")
ax.vlines(upper, ymin=y_lims[0], ymax=y_lims[1], label="+/- std")
ax.vlines(lower, ymin=y_lims[0], ymax=y_lims[1])

x_lims = ax.get_xlim()
ax.set_xlim(
    min(x_lims[0], lower),
    max(x_lims[1], upper),
)
ax.legend()
print("best:", best, "\nstd:", stdev, "\n+1std:", upper, "\n-1std:", lower)
best: 0.02239318117126179
std: 0.6606916434963407
+1std: 0.10251972610850342
-1std: 0.004891298309149119
[22]:
solver_dict = {
"solver_damping": {
"distribution": "normal",
"loc": np.log10(solver_damping), # mean of base 10 exponent
"scale": stdev, # standard deviation of base 10 exponent
"log": True,
},
}
fname = "../tmp/uncertainty_damping"
# delete files if already exist
for p in pathlib.Path().glob(f"{fname}*"):
p.unlink(missing_ok=True)
uncert_damping_results = uncertainty.full_workflow_uncertainty_loop(
fname=fname,
runs=10,
parameter_dict=solver_dict,
**uncert_kwargs,
)
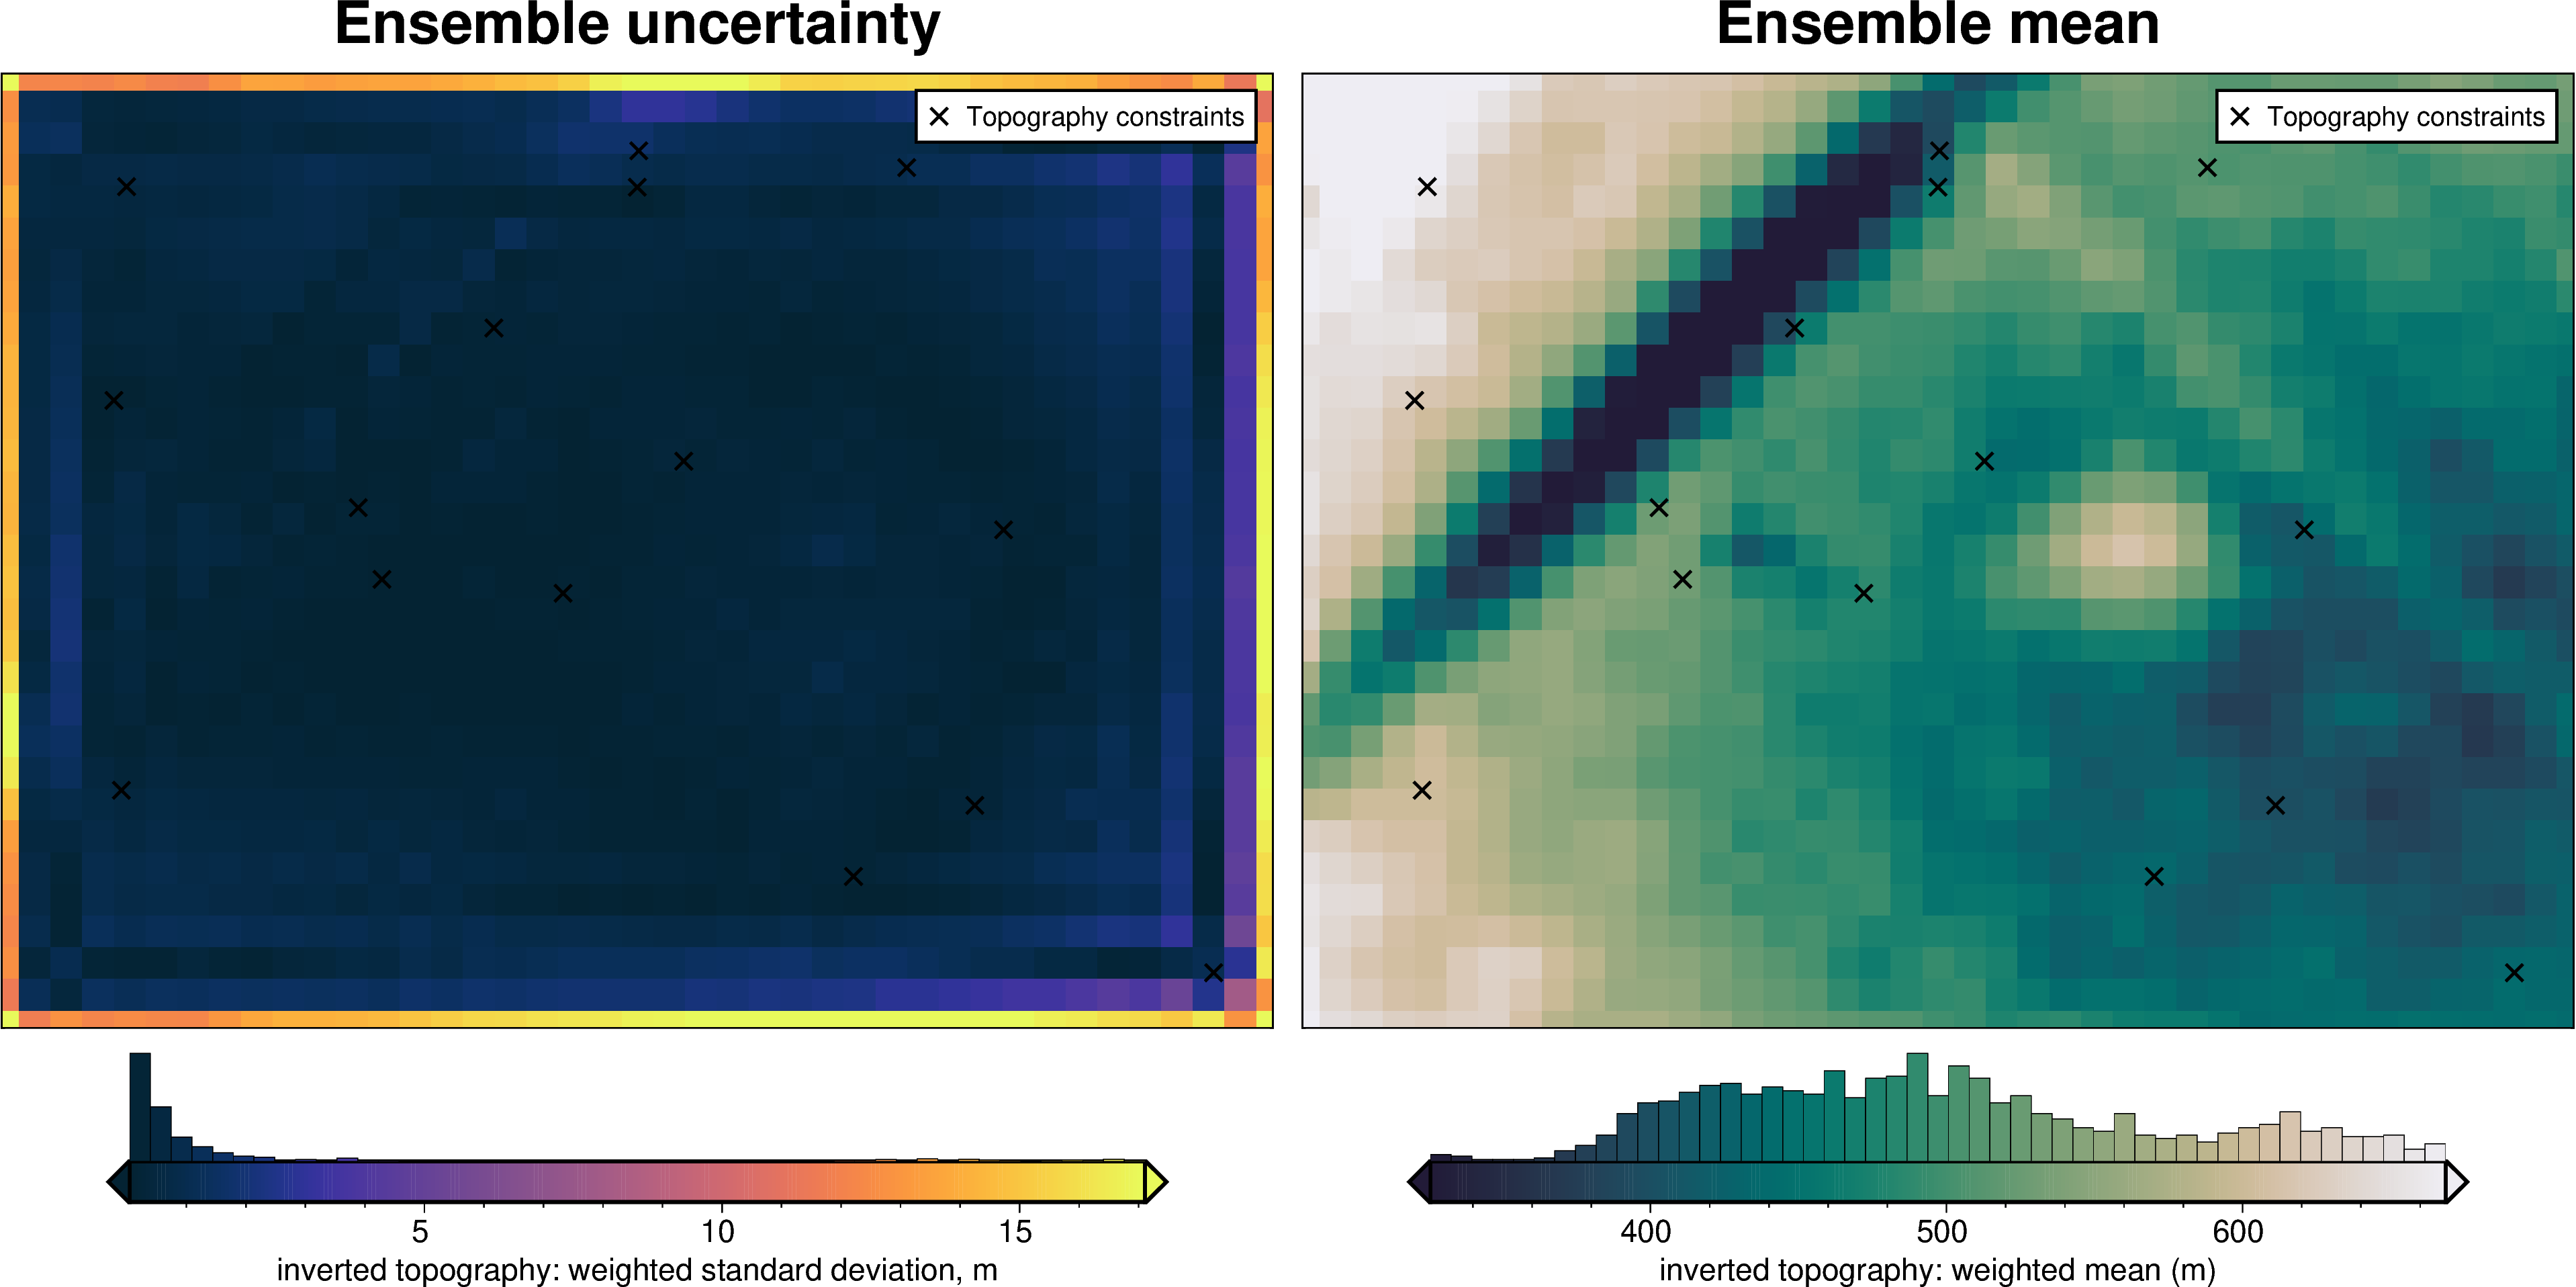
stats_ds = uncert_plots(
uncert_damping_results,
region,
spacing,
true_topography,
constraint_points=constraint_points,
weight_by="constraints",
)
INFO:invert4geom:Sampled 'solver_damping' parameter values; mean: 0.055707812123413136, min: 0.0018338961875135225, max: 0.2734367225272699
INFO:invert4geom:No pickle files starting with '../tmp/uncertainty_damping' found, creating new files
INFO:invert4geom:starting stochastic uncertainty analysis at run 0 of 10
saving results to pickle files with prefix: '../tmp/uncertainty_damping'
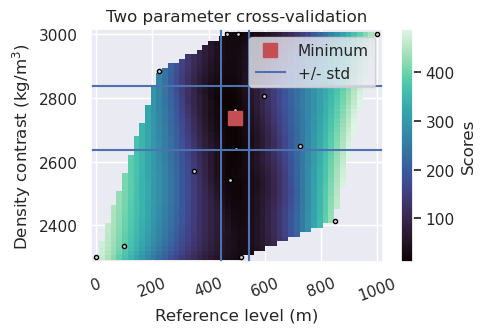
14.2. Z-ref and density components#
To estimate the uncertainty of the choice of Z-ref and density value, we will sample the values from random distributions.
[23]:
# choose standard deviations for the density contrast and zref
density_stdev = 100
zref_stdev = 50

# to re-load the study from the saved pickle file
with pathlib.Path("../tmp/combining_it_all_density_and_zref_cv_study.pickle").open(
    "rb"
) as f:
    study = pickle.load(f)

plotting.plot_2_parameter_cv_scores_uneven(
    study,
    param_names=(
        "params_zref",
        "params_density_contrast",
    ),
    plot_param_names=(
        "Reference level (m)",
        "Density contrast (kg/m$^3$)",
    ),
)

ax = plt.gca()

# plot zref stdev
upper = zref + zref_stdev
lower = zref - zref_stdev
y_lims = ax.get_ylim()
ax.vlines(upper, ymin=y_lims[0], ymax=y_lims[1], label="+/- std")
ax.vlines(lower, ymin=y_lims[0], ymax=y_lims[1])
x_lims = ax.get_xlim()
ax.set_xlim(
    min(x_lims[0], lower),
    max(x_lims[1], upper),
)
print("best:", zref, "\nstd:", zref_stdev, "\n+1std:", upper, "\n-1std:", lower)

# plot density contrast stdev
upper = density_contrast + density_stdev
lower = density_contrast - density_stdev
x_lims = ax.get_xlim()
ax.hlines(upper, xmin=x_lims[0], xmax=x_lims[1])
ax.hlines(lower, xmin=x_lims[0], xmax=x_lims[1])
y_lims = ax.get_ylim()
ax.set_ylim(
    min(y_lims[0], lower),
    max(y_lims[1], upper),
)
ax.legend()
print(
    "best:",
    density_contrast,
    "\nstd:",
    density_stdev,
    "\n+1std:",
    upper,
    "\n-1std:",
    lower,
)
best: 492.79238528548717
std: 50
+1std: 542.7923852854872
-1std: 442.79238528548717
best: 2735.0
std: 100
+1std: 2835.0
-1std: 2635.0
[24]:
density_dict = {
    "density_contrast": {
        "distribution": "normal",
        "loc": density_contrast,
        "scale": density_stdev,
    },
}
fname = "../tmp/uncertainty_density"

# delete files if already exist
for p in pathlib.Path().glob(f"{fname}*"):
    p.unlink(missing_ok=True)

uncert_density_results = uncertainty.full_workflow_uncertainty_loop(
    fname=fname,
    runs=10,
    parameter_dict=density_dict,
    **uncert_kwargs,
)

stats_ds = uncert_plots(
    uncert_density_results,
    region,
    spacing,
    true_topography,
    constraint_points=constraint_points,
    weight_by="constraints",
)
INFO:invert4geom:Sampled 'density_contrast' parameter values; mean: 2735.0, min: 2570.514637304853, max: 2899.485362695147
INFO:invert4geom:No pickle files starting with '../tmp/uncertainty_density' found, creating new files
INFO:invert4geom:starting stochastic uncertainty analysis at run 0 of 10
saving results to pickle files with prefix: '../tmp/uncertainty_density'

[25]:
zref_dict = {
    "zref": {
        "distribution": "normal",
        "loc": zref,
        "scale": zref_stdev,
    },
}
fname = "../tmp/uncertainty_zref"

# delete files if already exist
for p in pathlib.Path().glob(f"{fname}*"):
    p.unlink(missing_ok=True)

uncert_zref_results = uncertainty.full_workflow_uncertainty_loop(
    fname=fname,
    runs=10,
    parameter_dict=zref_dict,
    **uncert_kwargs,
)

stats_ds = uncert_plots(
    uncert_zref_results,
    region,
    spacing,
    true_topography,
    constraint_points=constraint_points,
    weight_by="constraints",
)
INFO:invert4geom:Sampled 'zref' parameter values; mean: 492.7923852854871, min: 410.54970393791353, max: 575.0350666330608
INFO:invert4geom:No pickle files starting with '../tmp/uncertainty_zref' found, creating new files
INFO:invert4geom:starting stochastic uncertainty analysis at run 0 of 10
saving results to pickle files with prefix: '../tmp/uncertainty_zref'

14.3. Constraints component#
[26]:
fname = "../tmp/uncertainty_constraints"

# delete files if already exist
for p in pathlib.Path().glob(f"{fname}*"):
    p.unlink(missing_ok=True)

uncert_constraints_results = uncertainty.full_workflow_uncertainty_loop(
    fname=fname,
    sample_constraints=True,
    constraints_df=constraint_points,
    starting_topography_kwargs=starting_topography_kwargs,
    runs=10,
    **uncert_kwargs,
)

stats_ds = uncert_plots(
    uncert_constraints_results,
    region,
    spacing,
    true_topography,
    constraint_points=constraint_points,
    weight_by="constraints",
)
INFO:invert4geom:No pickle files starting with '../tmp/uncertainty_constraints' found, creating new files
INFO:invert4geom:starting stochastic uncertainty analysis at run 0 of 10
saving results to pickle files with prefix: '../tmp/uncertainty_constraints'
14.4. Gravity component#
[27]:
grav_df.describe()
[27]:
| northing | easting | upward | upper_surface_grav | lower_surface_grav | observed_grav | gravity_anomaly | uncert | starting_gravity | true_res | misfit | reg | res | staring_res | starting_reg | |
|---|---|---|---|---|---|---|---|---|---|---|---|---|---|---|---|
| count | 4941.000000 | 4941.000000 | 4941.0 | 4941.000000 | 4941.000000 | 4941.000000 | 4941.000000 | 4.941000e+03 | 4941.000000 | 4941.000000 | 4941.000000 | 4941.000000 | 4941.000000 | 4941.000000 | 4941.000000 |
| mean | 15000.000000 | 20000.000000 | 1001.0 | -0.229678 | 0.004286 | -0.225392 | -0.225332 | 1.000000e-01 | 0.517690 | -1.254871 | -0.743022 | -0.134885 | -0.608137 | -0.608137 | -0.134885 |
| std | 8804.299419 | 11691.635129 | 0.0 | 7.103507 | 0.720692 | 7.247722 | 7.245591 | 1.064189e-10 | 7.538787 | 4.621594 | 5.076524 | 1.376126 | 4.572632 | 4.572632 | 1.376126 |
| min | 0.000000 | 0.000000 | 1001.0 | -17.227928 | -1.034071 | -16.940400 | -17.040892 | 1.000000e-01 | -9.430753 | -19.592049 | -20.057107 | -2.560355 | -18.518955 | -18.518955 | -2.560355 |
| 25% | 7500.000000 | 10000.000000 | 1001.0 | -5.587227 | -0.610336 | -5.906763 | -5.910496 | 1.000000e-01 | -5.500220 | -3.008015 | -2.800362 | -1.230061 | -2.338344 | -2.338344 | -1.230061 |
| 50% | 15000.000000 | 20000.000000 | 1001.0 | -1.239580 | -0.155380 | -0.822890 | -0.813296 | 1.000000e-01 | -1.442872 | -1.483188 | -1.207388 | -0.191240 | -0.616647 | -0.616647 | -0.191240 |
| 75% | 22500.000000 | 30000.000000 | 1001.0 | 3.490030 | 0.542849 | 3.738912 | 3.726649 | 1.000000e-01 | 5.248543 | 0.577570 | 1.437138 | 1.026287 | 1.260866 | 1.260866 | 1.026287 |
| max | 30000.000000 | 40000.000000 | 1001.0 | 19.754954 | 1.602413 | 19.932831 | 19.959187 | 1.000000e-01 | 25.047338 | 13.969991 | 15.352249 | 2.279162 | 14.666685 | 14.666685 | 2.279162 |
[28]:
grav_df.res
[28]:
0      -0.543986
1      -1.134643
2      -0.868003
3      -0.751438
4      -0.661081
          ...
4936   -5.933460
4937   -6.187334
4938   -6.292103
4939   -6.222844
4940   -5.557404
Name: res, Length: 4941, dtype: float64
[29]:
fname = "../tmp/uncertainty_grav"

# delete files if already exist
for p in pathlib.Path().glob(f"{fname}*"):
    p.unlink(missing_ok=True)

uncert_grav_results = uncertainty.full_workflow_uncertainty_loop(
    fname=fname,
    runs=10,
    sample_gravity=True,
    **uncert_kwargs,
)

stats_ds = uncert_plots(
    uncert_grav_results,
    region,
    spacing,
    true_topography,
    constraint_points=constraint_points,
    weight_by="constraints",
)
INFO:invert4geom:No pickle files starting with '../tmp/uncertainty_grav' found, creating new files
INFO:invert4geom:starting stochastic uncertainty analysis at run 0 of 10
saving results to pickle files with prefix: '../tmp/uncertainty_grav'
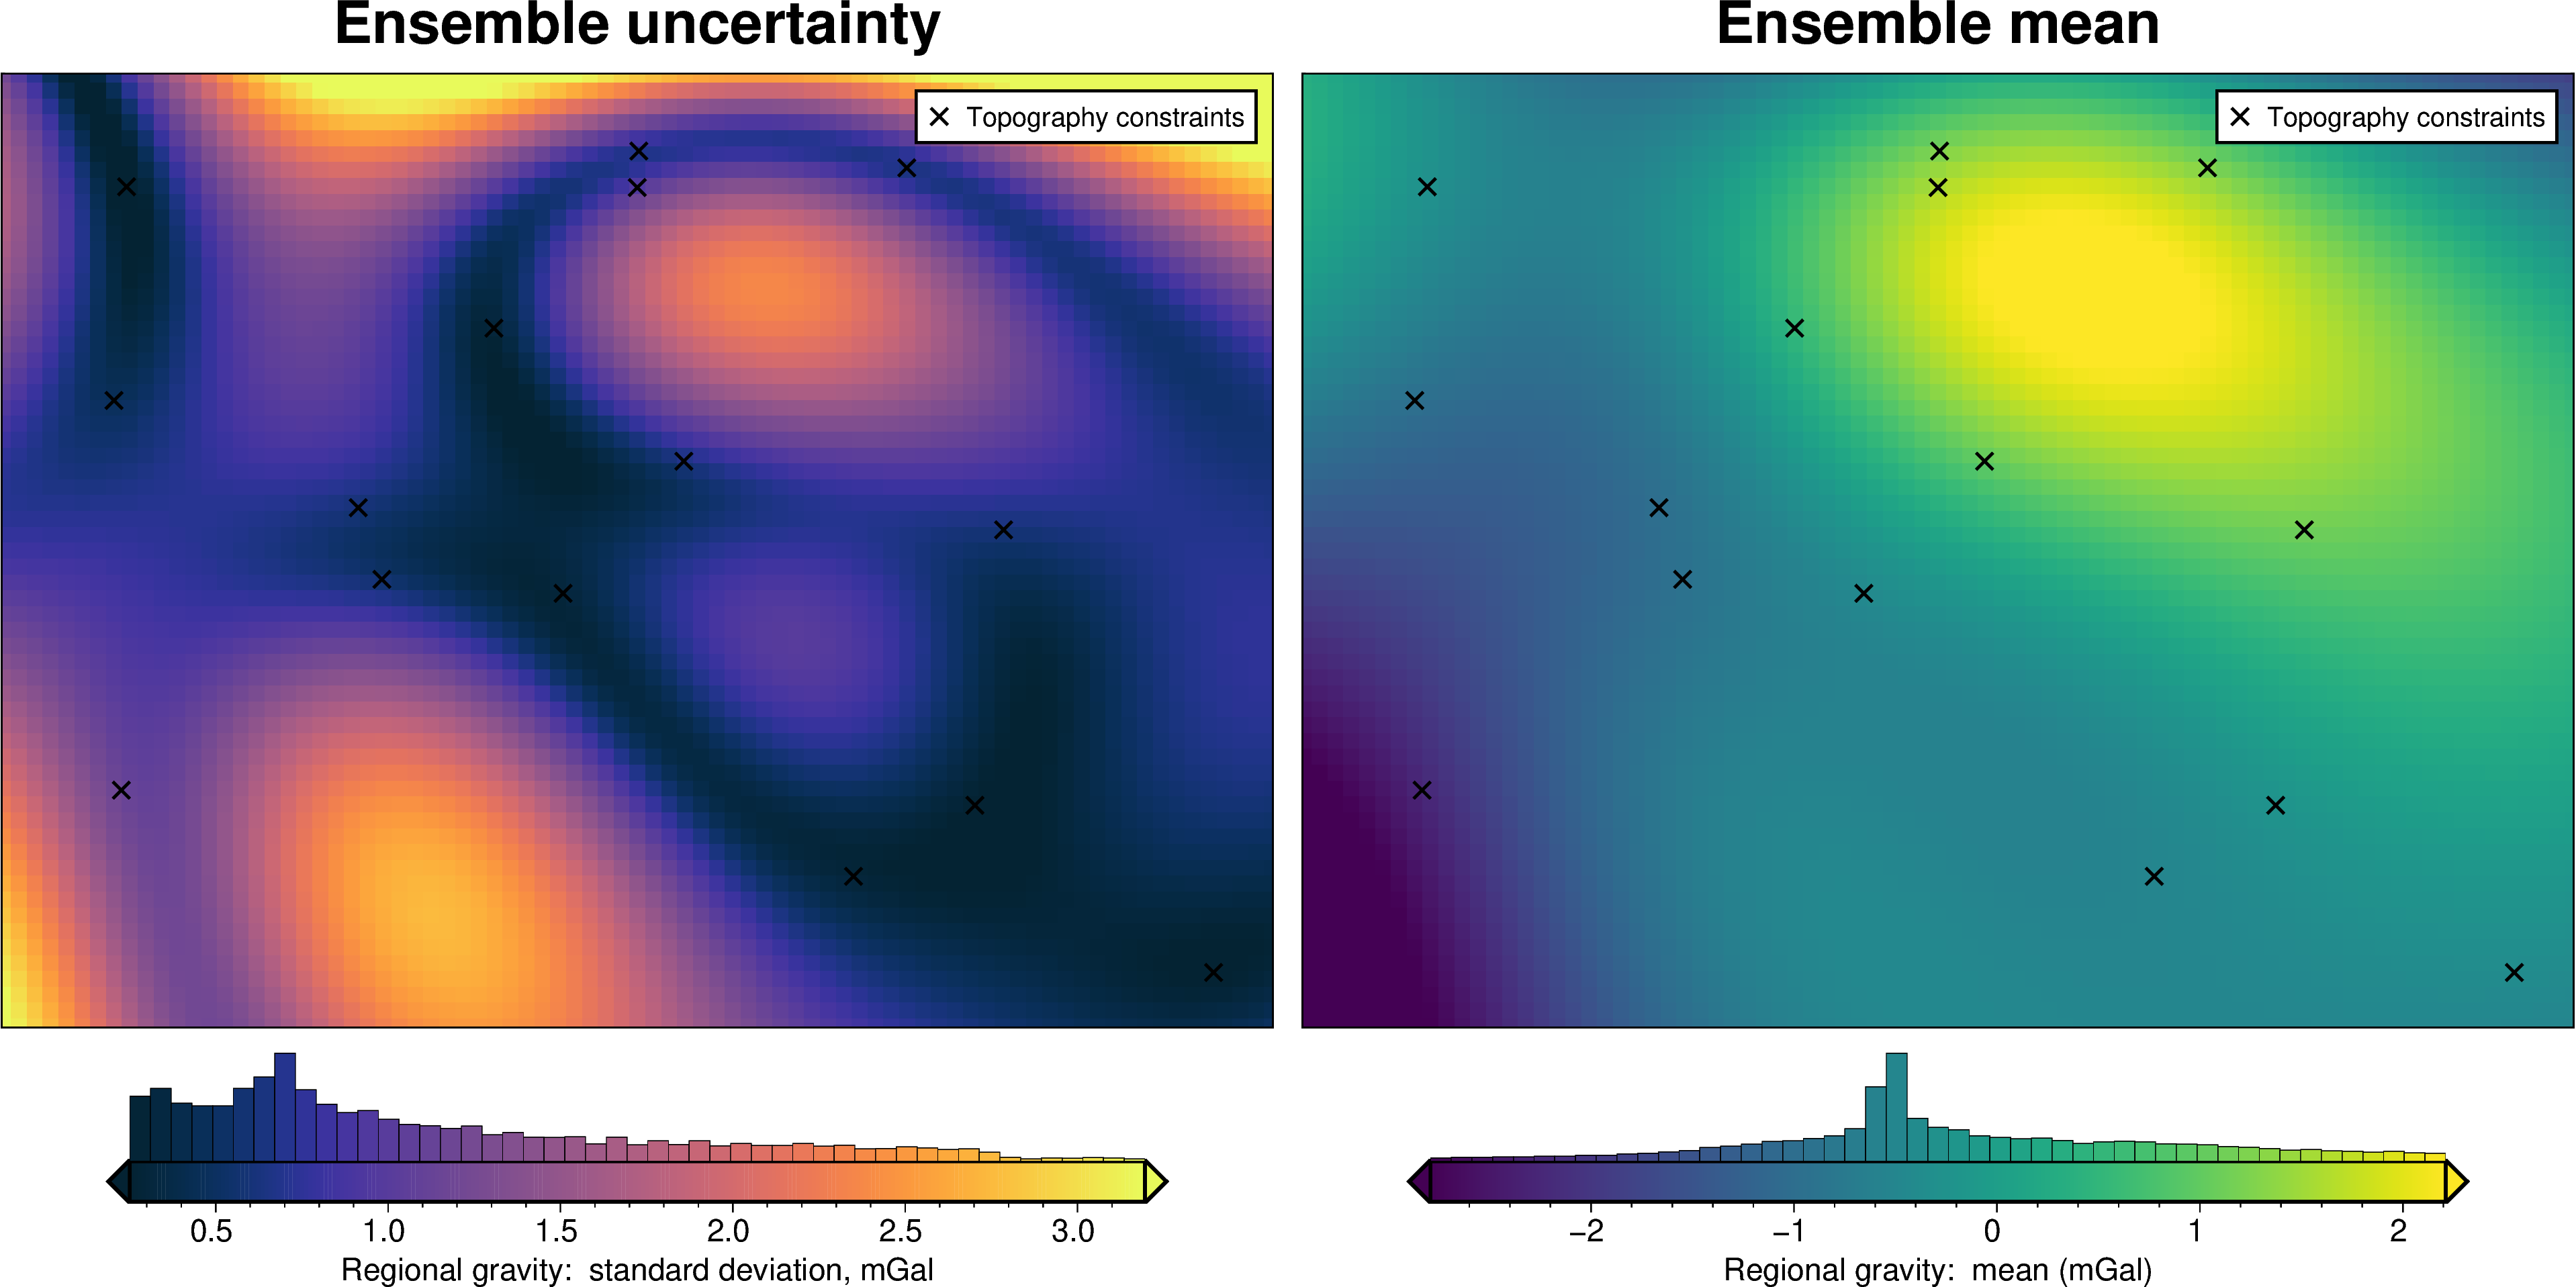
14.5. Regional gravity component#
[30]:
reg_eq_depth, reg_eq_damping
[30]:
(np.float64(25196.204289908077), 0.04881091466863527)
[31]:
regional_misfit_parameter_dict = {
    "depth": {
        "distribution": "normal",
        "loc": reg_eq_depth,  # mean
        "scale": reg_eq_depth / 10,  # standard deviation
    },
    "damping": {
        "distribution": "normal",
        "loc": np.log10(reg_eq_damping),  # mean base 10 exponent
        # "scale": np.abs(np.log10(reg_eq_damping)),  # standard deviation of exponent
        "scale": 4,
        "log": True,
    },
}

regional_misfit_stats, _ = uncertainty.regional_misfit_uncertainty(
    runs=100,
    parameter_dict=regional_misfit_parameter_dict,
    true_regional=grav_grid.lower_surface_grav,
    # weight_by="constraints",
    # weight_by="residual",
    # weight_by=None,
    grav_df=grav_df,
    **new_regional_grav_kwargs,
)
INFO:invert4geom:Sampled 'depth' parameter values; mean: 25196.204289908077, min: 18706.0921550931, max: 31686.316424723052
INFO:invert4geom:Sampled 'damping' parameter values; mean: 10095310.008659463, min: 2.4277263483714883e-12, max: 981373124.0289752
[32]:
grav_grid = grav_df.set_index(["northing", "easting"]).to_xarray()
grav_grid["reg_uncert"] = regional_misfit_stats.z_stdev
grav_df_new = vd.grid_to_table(grav_grid)
grav_df_new
[32]:
| northing | easting | test | upward | upper_surface_grav | lower_surface_grav | observed_grav | gravity_anomaly | uncert | starting_gravity | true_res | misfit | reg | res | staring_res | starting_reg | reg_uncert | |
|---|---|---|---|---|---|---|---|---|---|---|---|---|---|---|---|---|---|
| 0 | 0.0 | 0.0 | False | 1001.0 | 9.042402 | -0.041223 | 9.001179 | 9.017793 | 0.1 | 12.100747 | -2.349335 | -3.082955 | -2.538969 | -0.543986 | -0.543986 | -2.538969 | 3.284866 |
| 1 | 0.0 | 500.0 | True | 1001.0 | 9.380272 | -0.046312 | 9.333959 | 9.331242 | 0.1 | 13.005580 | -2.531914 | -3.674339 | -2.539696 | -1.134643 | -1.134643 | -2.539696 | 3.096668 |
| 2 | 0.0 | 1000.0 | False | 1001.0 | 9.568091 | -0.052122 | 9.515969 | 9.506800 | 0.1 | 12.913705 | -2.657964 | -3.406905 | -2.538902 | -0.868003 | -0.868003 | -2.538902 | 2.901981 |
| 3 | 0.0 | 1500.0 | True | 1001.0 | 9.298147 | -0.059918 | 9.238228 | 9.269420 | 0.1 | 12.557419 | -2.625601 | -3.287998 | -2.536560 | -0.751438 | -0.751438 | -2.536560 | 2.702328 |
| 4 | 0.0 | 2000.0 | False | 1001.0 | 8.893385 | -0.068787 | 8.824597 | 8.892680 | 0.1 | 12.086407 | -2.514374 | -3.193727 | -2.532646 | -0.661081 | -0.661081 | -2.532646 | 2.499585 |
| ... | ... | ... | ... | ... | ... | ... | ... | ... | ... | ... | ... | ... | ... | ... | ... | ... | ... |
| 4936 | 30000.0 | 38000.0 | False | 1001.0 | 2.982330 | 0.607664 | 3.589994 | 3.623280 | 0.1 | 7.491087 | -4.259751 | -3.867807 | 2.065653 | -5.933460 | -5.933460 | 2.065653 | 4.732663 |
| 4937 | 30000.0 | 38500.0 | True | 1001.0 | 2.931601 | 0.580987 | 3.512587 | 3.472411 | 0.1 | 7.617747 | -4.529030 | -4.145336 | 2.041997 | -6.187334 | -6.187334 | 2.041997 | 4.786413 |
| 4938 | 30000.0 | 39000.0 | False | 1001.0 | 2.946999 | 0.545480 | 3.492479 | 3.401948 | 0.1 | 7.676430 | -4.573146 | -4.274481 | 2.017622 | -6.292103 | -6.292103 | 2.017622 | 4.835166 |
| 4939 | 30000.0 | 39500.0 | True | 1001.0 | 2.873747 | 0.495910 | 3.369657 | 3.335928 | 0.1 | 7.566170 | -4.249337 | -4.230242 | 1.992601 | -6.222844 | -6.222844 | 1.992601 | 4.879032 |
| 4940 | 30000.0 | 40000.0 | False | 1001.0 | 2.784613 | 0.441061 | 3.225674 | 3.282663 | 0.1 | 6.873059 | -3.788240 | -3.590396 | 1.967008 | -5.557404 | -5.557404 | 1.967008 | 4.918154 |
4941 rows × 17 columns
[33]:
# update grav_df
uncert_kwargs["grav_df"] = grav_df_new
[34]:
fname = "../tmp/uncertainty_regional"
# delete files if already exist
for p in pathlib.Path().glob(f"{fname}*"):
p.unlink(missing_ok=True)
uncert_regional_results = uncertainty.full_workflow_uncertainty_loop(
fname=fname,
runs=10,
regional_misfit_parameter_dict=regional_misfit_parameter_dict,
**uncert_kwargs,
)
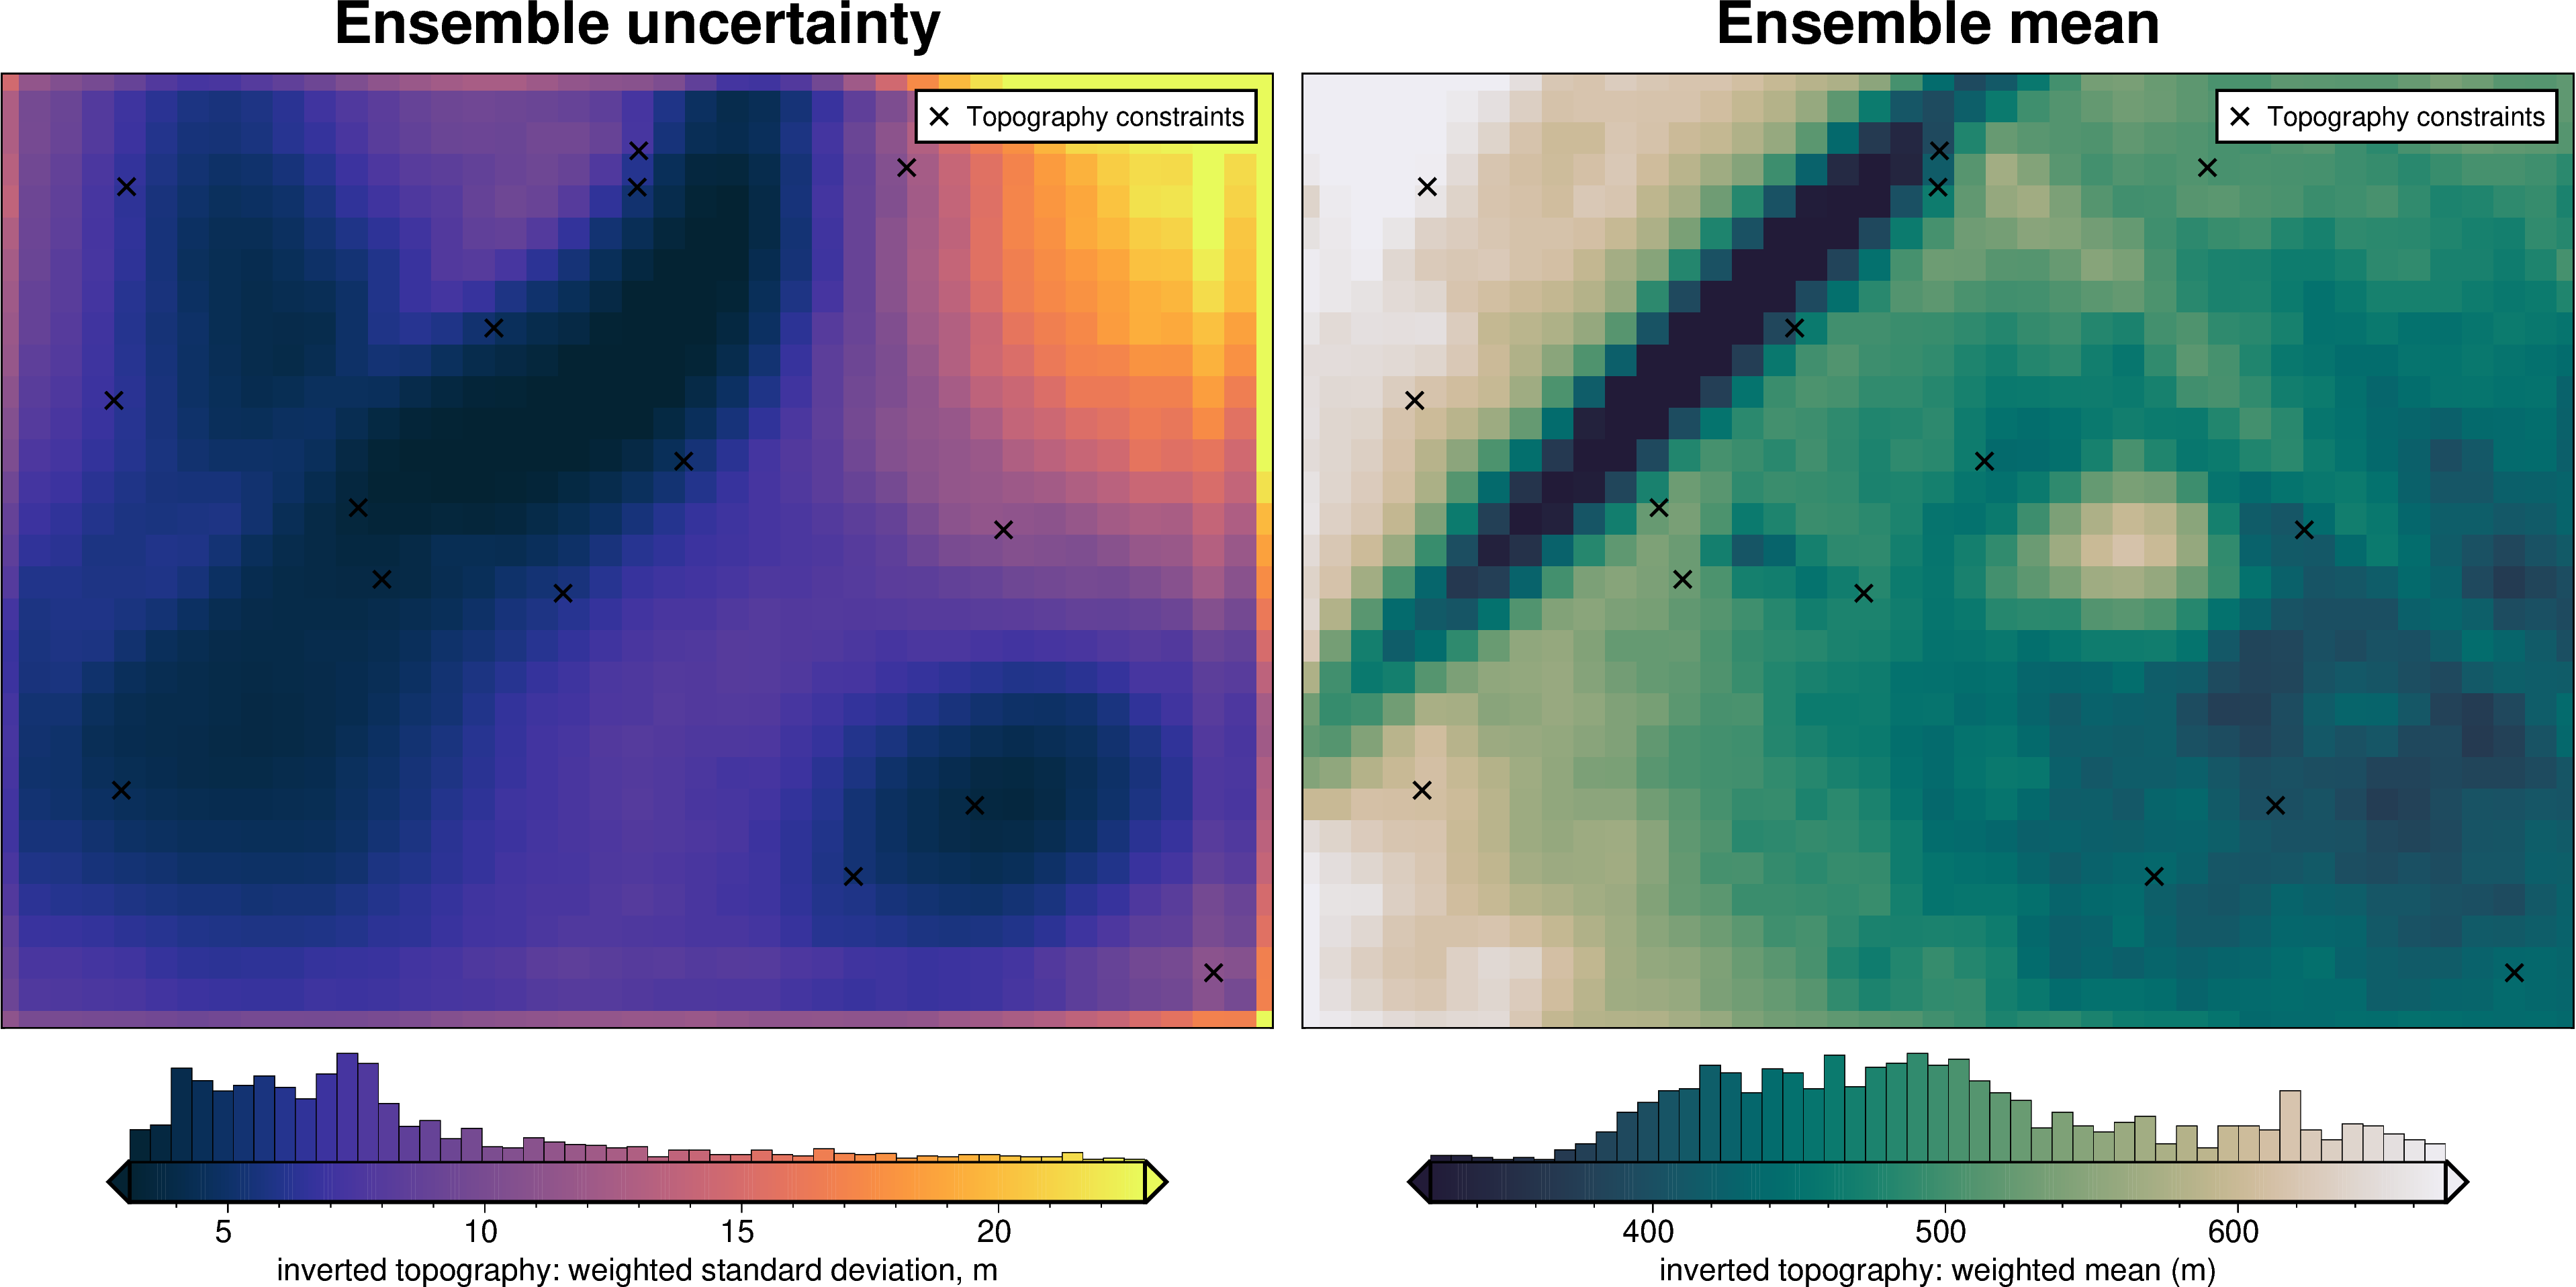
stats_ds = uncert_plots(
uncert_regional_results,
region,
spacing,
true_topography,
constraint_points=constraint_points,
weight_by="constraints",
)
INFO:invert4geom:Sampled 'depth' parameter values; mean: 25196.204289908077, min: 21051.797488741522, max: 29340.611091074632
INFO:invert4geom:Sampled 'damping' parameter values; mean: 18603.286041063246, min: 1.285589859638123e-08, max: 185323.90971560893
INFO:invert4geom:No pickle files starting with '../tmp/uncertainty_regional' found, creating new files
INFO:invert4geom:starting stochastic uncertainty analysis at run 0 of 10
saving results to pickle files with prefix: '../tmp/uncertainty_regional'
14.6. Total uncertainty#
[35]:
fname = "../tmp/uncertainty_full"

# delete files if already exist
for p in pathlib.Path().glob(f"{fname}*"):
    p.unlink(missing_ok=True)

uncert_results = uncertainty.full_workflow_uncertainty_loop(
    fname=fname,
    runs=20,
    sample_gravity=True,
    sample_constraints=True,
    constraints_df=constraint_points,
    parameter_dict=solver_dict | density_dict | zref_dict,
    regional_misfit_parameter_dict=regional_misfit_parameter_dict,
    starting_topography_kwargs=starting_topography_kwargs,
    **uncert_kwargs,
)

stats_ds = uncert_plots(
    uncert_results,
    region,
    spacing,
    true_topography,
    constraint_points=constraint_points,
    weight_by="constraints",
)
INFO:invert4geom:Sampled 'solver_damping' parameter values; mean: 0.06081861824860846, min: 0.001135491709342105, max: 0.4416188677057745
INFO:invert4geom:Sampled 'density_contrast' parameter values; mean: 2734.9999999999995, min: 2539.0036015459946, max: 2930.9963984540054
INFO:invert4geom:Sampled 'zref' parameter values; mean: 492.7923852854872, min: 394.79418605848446, max: 590.79058451249
INFO:invert4geom:Sampled 'depth' parameter values; mean: 25196.20428990808, min: 20257.83899437473, max: 30134.569585441426
INFO:invert4geom:Sampled 'damping' parameter values; mean: 170301.0793548694, min: 7.057664473265911e-10, max: 3375770.2704820298
INFO:invert4geom:No pickle files starting with '../tmp/uncertainty_full' found, creating new files
INFO:invert4geom:starting stochastic uncertainty analysis at run 0 of 20
saving results to pickle files with prefix: '../tmp/uncertainty_full'
14.7. Comparing results#
[36]:
results = [
    uncert_results,
    uncert_regional_results,
    uncert_grav_results,
    uncert_constraints_results,
    uncert_density_results,
    uncert_damping_results,
]
names = [
    "full",
    "regional",
    "grav",
    "constraints",
    "density",
    "damping",
]
# get cell-wise stats for each ensemble
stats = []
for r in results:
    ds = uncertainty.merged_stats(
        results=r,
        plot=False,
        constraints_df=constraint_points,
        weight_by="constraints",
        # region=vd.pad_region(region, -spacing),
    )
    stats.append(ds)
[37]:
# get the standard deviation of the ensemble of ensembles
stdevs = []
for i, s in enumerate(stats):
    stdevs.append(s.weighted_stdev.rename(f"{names[i]}_stdev"))

merged = xr.merge(stdevs)
merged
[37]:
<xarray.Dataset> Size: 62kB
Dimensions:            (northing: 31, easting: 41)
Coordinates:
  * northing           (northing) float64 248B 0.0 1e+03 2e+03 ... 2.9e+04 3e+04
  * easting            (easting) float64 328B 0.0 1e+03 2e+03 ... 3.9e+04 4e+04
Data variables:
    full_stdev         (northing, easting) float64 10kB 51.99 58.87 ... 60.47
    regional_stdev     (northing, easting) float64 10kB 37.96 30.24 ... 62.07
    grav_stdev         (northing, easting) float64 10kB 2.295 1.828 ... 1.862
    constraints_stdev  (northing, easting) float64 10kB 11.18 9.943 ... 41.81
    density_stdev      (northing, easting) float64 10kB 0.1888 0.7488 ... 2.184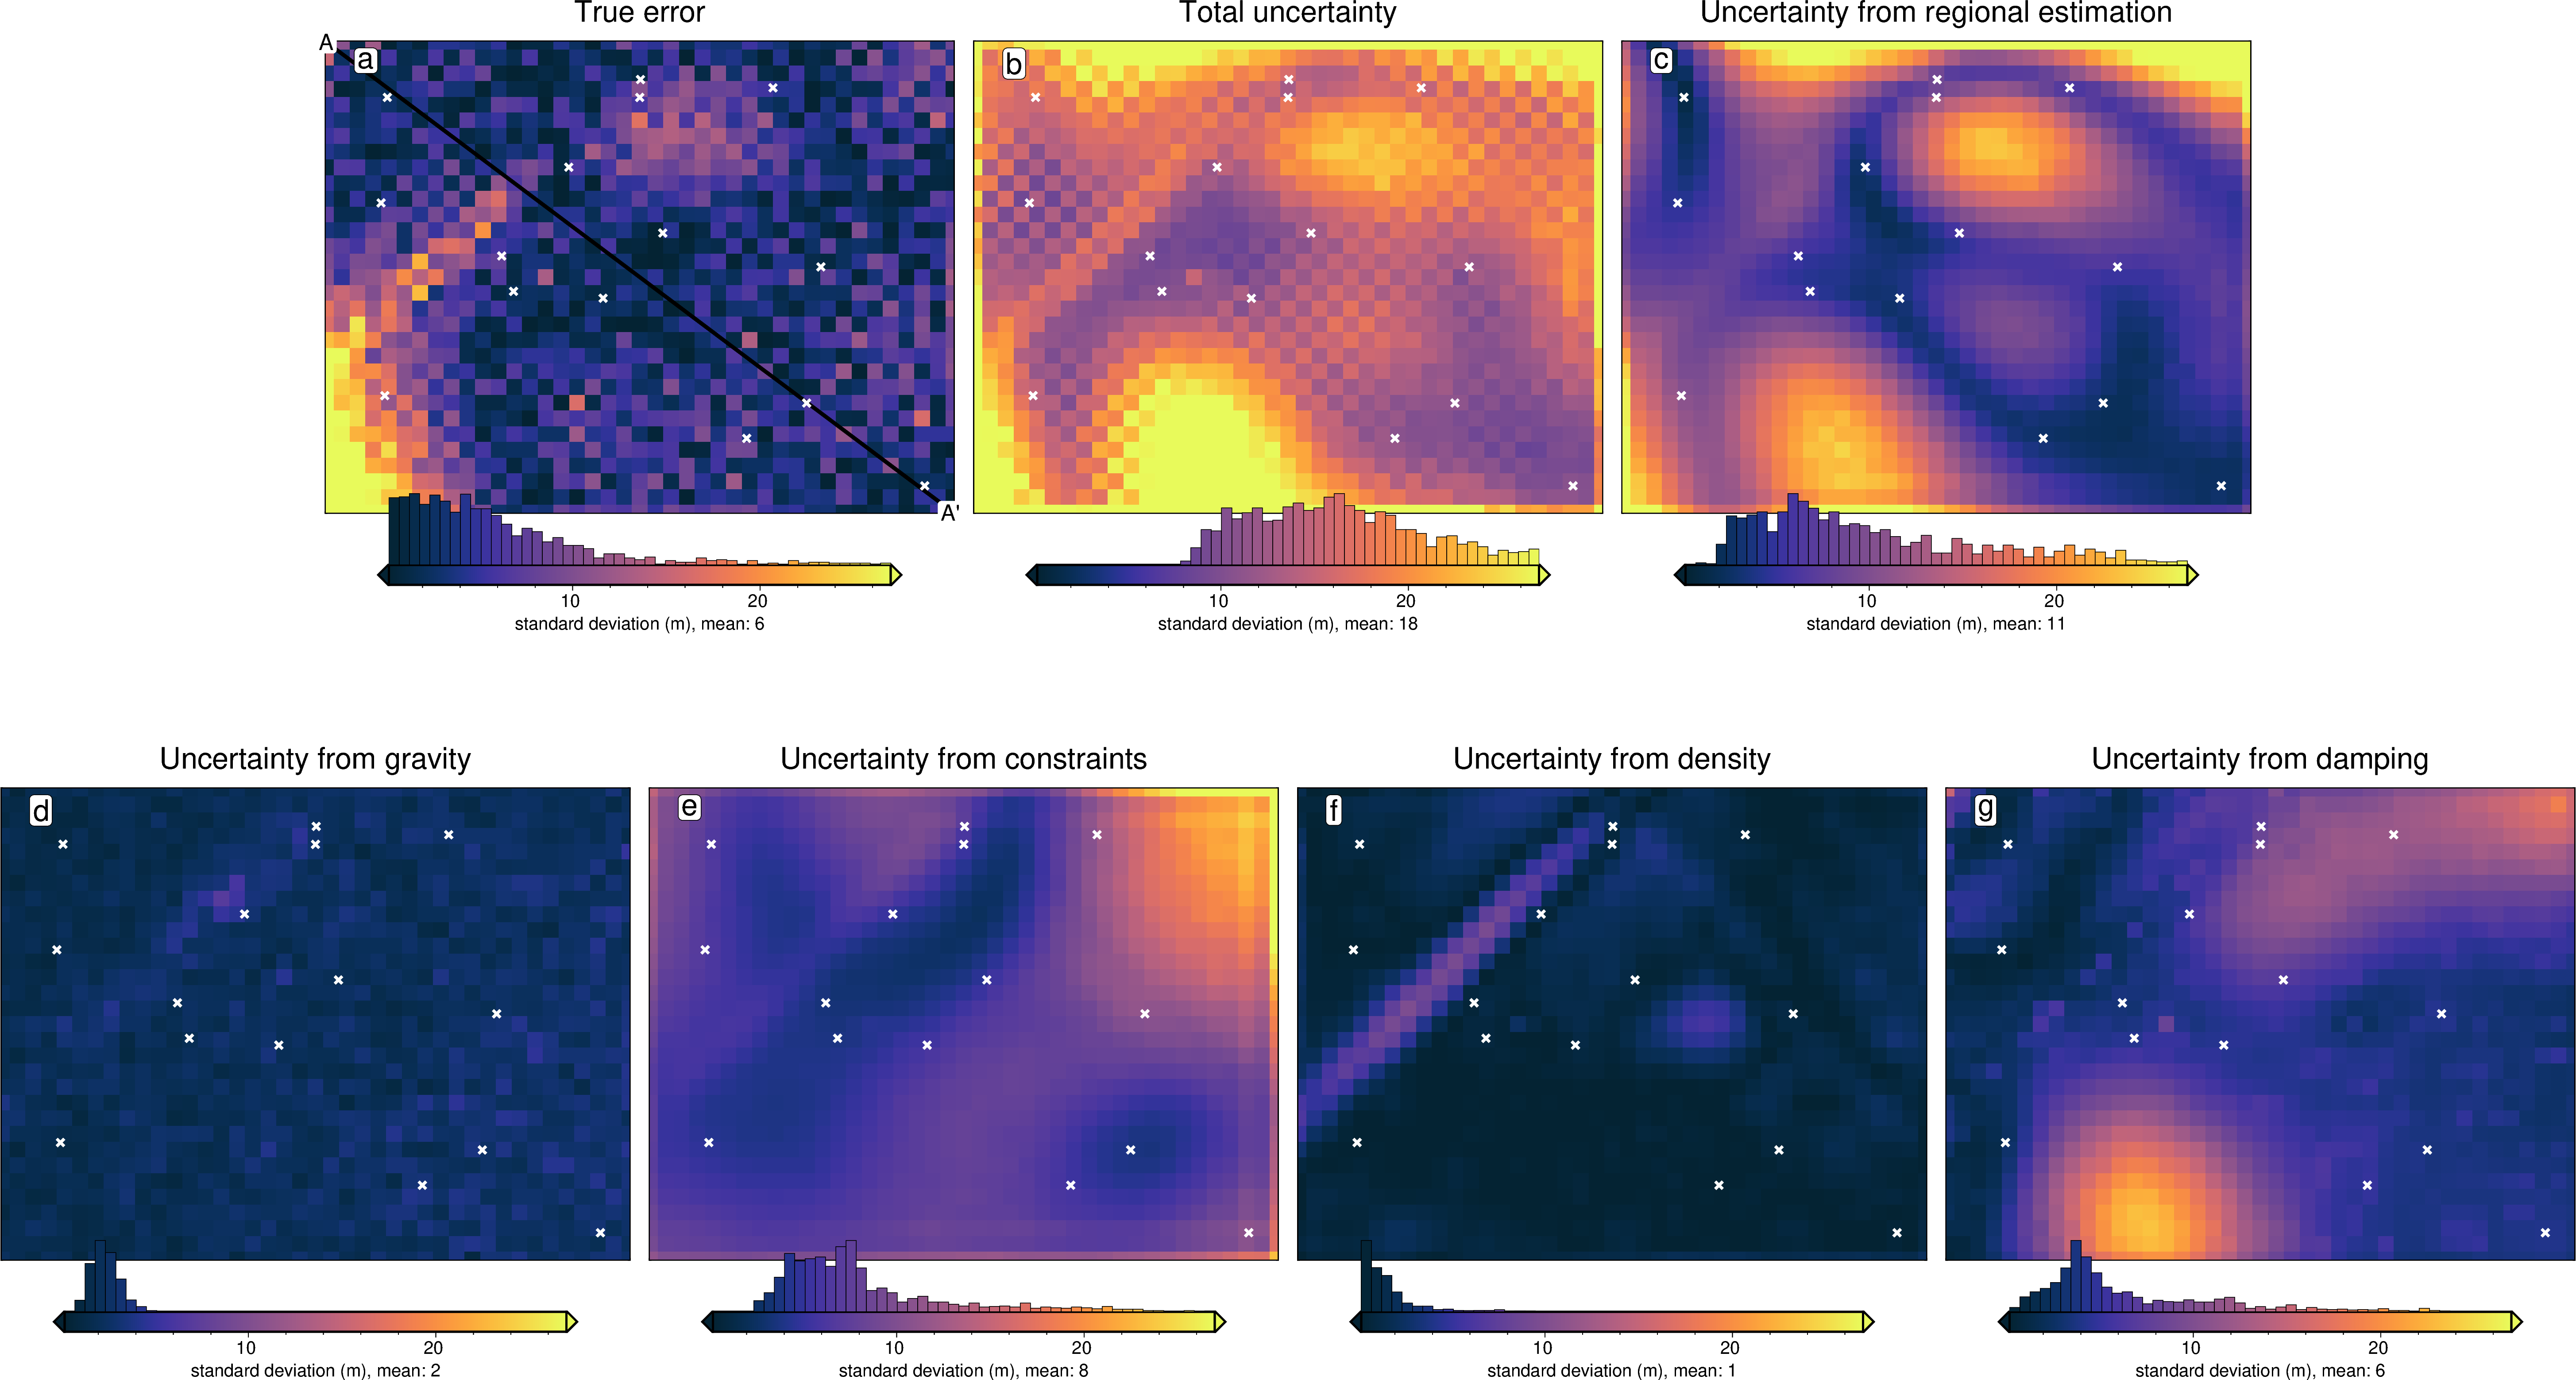
damping_stdev (northing, easting) float64 10kB 0.7171 1.013 ... 15.45[38]:
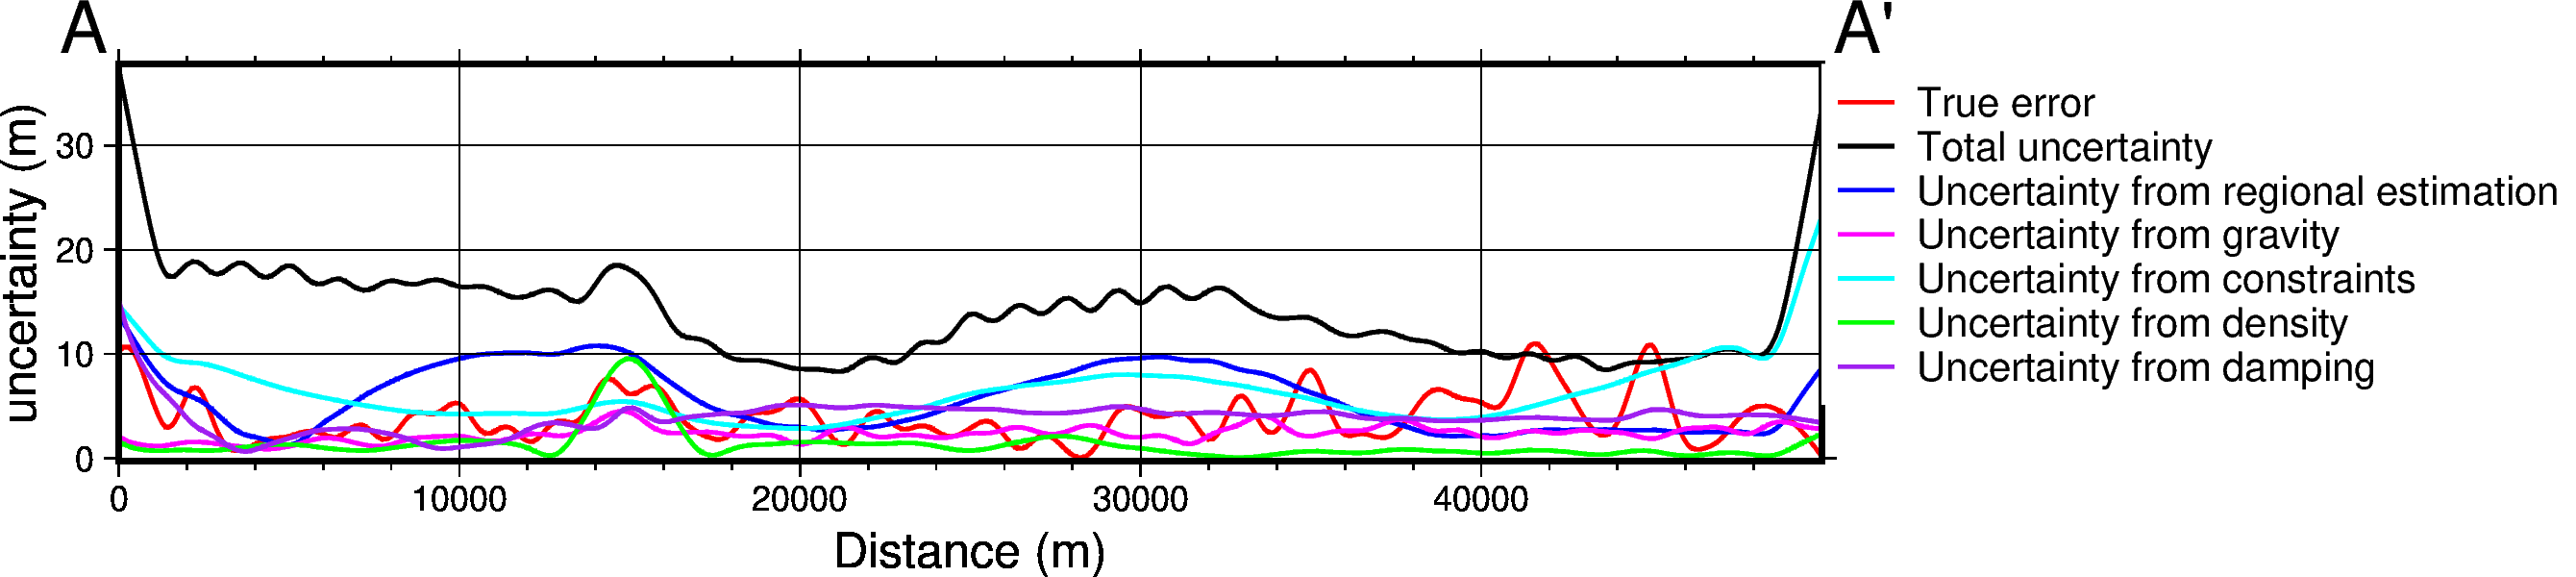
titles = [
    "True error",
    "Total uncertainty",
    "Uncertainty from regional estimation",
    "Uncertainty from gravity",
    "Uncertainty from constraints",
    "Uncertainty from density",
    "Uncertainty from damping",
]
grids = list(merged.data_vars.values())

grids.insert(0, np.abs(stats[0].weighted_mean - true_topography))

cpt_lims = polar_utils.get_min_max(
    grids[0],
    robust=True,
)

fig_height = 9
for i, g in enumerate(grids):
    xshift_amount = 1
    if i == 0:
        fig = None
        origin_shift = "initialize"
    elif i == 3:
        origin_shift = "both"
        xshift_amount = -2.5
    else:
        origin_shift = "x"

    fig = maps.plot_grd(
        grid=g,
        fig_height=fig_height,
        title=titles[i],
        title_font="16p,Helvetica,black",
        cmap="thermal",
        cpt_lims=cpt_lims,
        robust=True,
        cbar_label=f"standard deviation (m), mean: {int(np.nanmean(g))}",
        hist=True,
        hist_bin_num=50,
        cbar_yoffset=1,
        fig=fig,
        origin_shift=origin_shift,
        xshift_amount=xshift_amount,
    )
    if i == 0:
        # plot profile location, and endpoints on map
        start = [region[0], region[3]]
        stop = [region[1], region[2]]
        fig.plot(
            vd.line_coordinates(start, stop, size=100),
            pen="2p,black",
        )
        fig.text(
            x=start[0],
            y=start[1],
            text="A",
            fill="white",
            font="12p,Helvetica,black",
            justify="CM",
            clearance="+tO",
            no_clip=True,
        )
        fig.text(
            x=stop[0],
            y=stop[1],
            text="A' ",
            fill="white",
            font="12p,Helvetica,black",
            justify="CM",
            clearance="+tO",
            no_clip=True,
        )
    fig.plot(
        x=constraint_points.easting,
        y=constraint_points.northing,
        style="x.2c",
        pen="1.5p,white",
        fill="white",
    )
    fig.text(
        position="TL",
        text=f"{string.ascii_lowercase[i]}",
        fill="white",
        pen=True,
        font="16p,Helvetica,black",
        offset="j.6/.2",
        clearance="+tO",
        no_clip=True,
    )
fig.show()
[39]:
data_dict = profiles.make_data_dict(
    names=titles,
    grids=grids,
    colors=[
        "red",
        "black",
        "blue",
        "magenta",
        "cyan",
        "green",
        "purple",
    ],
)

fig, df_data = profiles.plot_data(
    "points",
    start=[region[0], region[3]],
    stop=[region[1], region[2]],
    num=10000,
    fig_height=4,
    fig_width=15,
    data_dict=data_dict,
    data_legend_loc="jTR+jTL",
    data_legend_box="+gwhite",
    data_buffer=0.01,
    data_frame=["neSW", "xafg+lDistance (m)", "yag+luncertainty (m)"],
    # data_pen_style=[None,None,"4_2:2p"],
    # data_pen_thickness=[1, 1.5, 1],
    share_yaxis=True,
    start_label="A",
    end_label="A' ",
)
fig.show()