Sub-ice shelf bathymetry#
Floating ice shelves present a challenge to measuring the shape of the seafloor beneath them. Conventional techniques of measuring bathymetry / bed topography, such as shipboard multibeam offshore, or airborne radar onshore, in not possible due to the consistent ice coverage. Inversion of airborne gravity data provides a technique to model the bathymetry in these regions. Here we will demonstrate the gravity reduction and inversion steps unique to a sub-ice shelf bathymetry inversion. We will apply this to a portion of Antarctica’s Filchner-Ronne Ice Shelf.
Import packages#
[1]:
# %load_ext autoreload
# %autoreload 2
import os
import pandas as pd
import polartoolkit as ptk
import invert4geom
# set EPSG for plotting functions
os.environ["POLARTOOLKIT_EPSG"] = "3031"
/home/mdtanker/invert4geom/.pixi/envs/default/lib/python3.13/site-packages/UQpy/__init__.py:6: UserWarning: pkg_resources is deprecated as an API. See https://setuptools.pypa.io/en/latest/pkg_resources.html. The pkg_resources package is slated for removal as early as 2025-11-30. Refrain from using this package or pin to Setuptools<81.
import pkg_resources
Get gravity data#
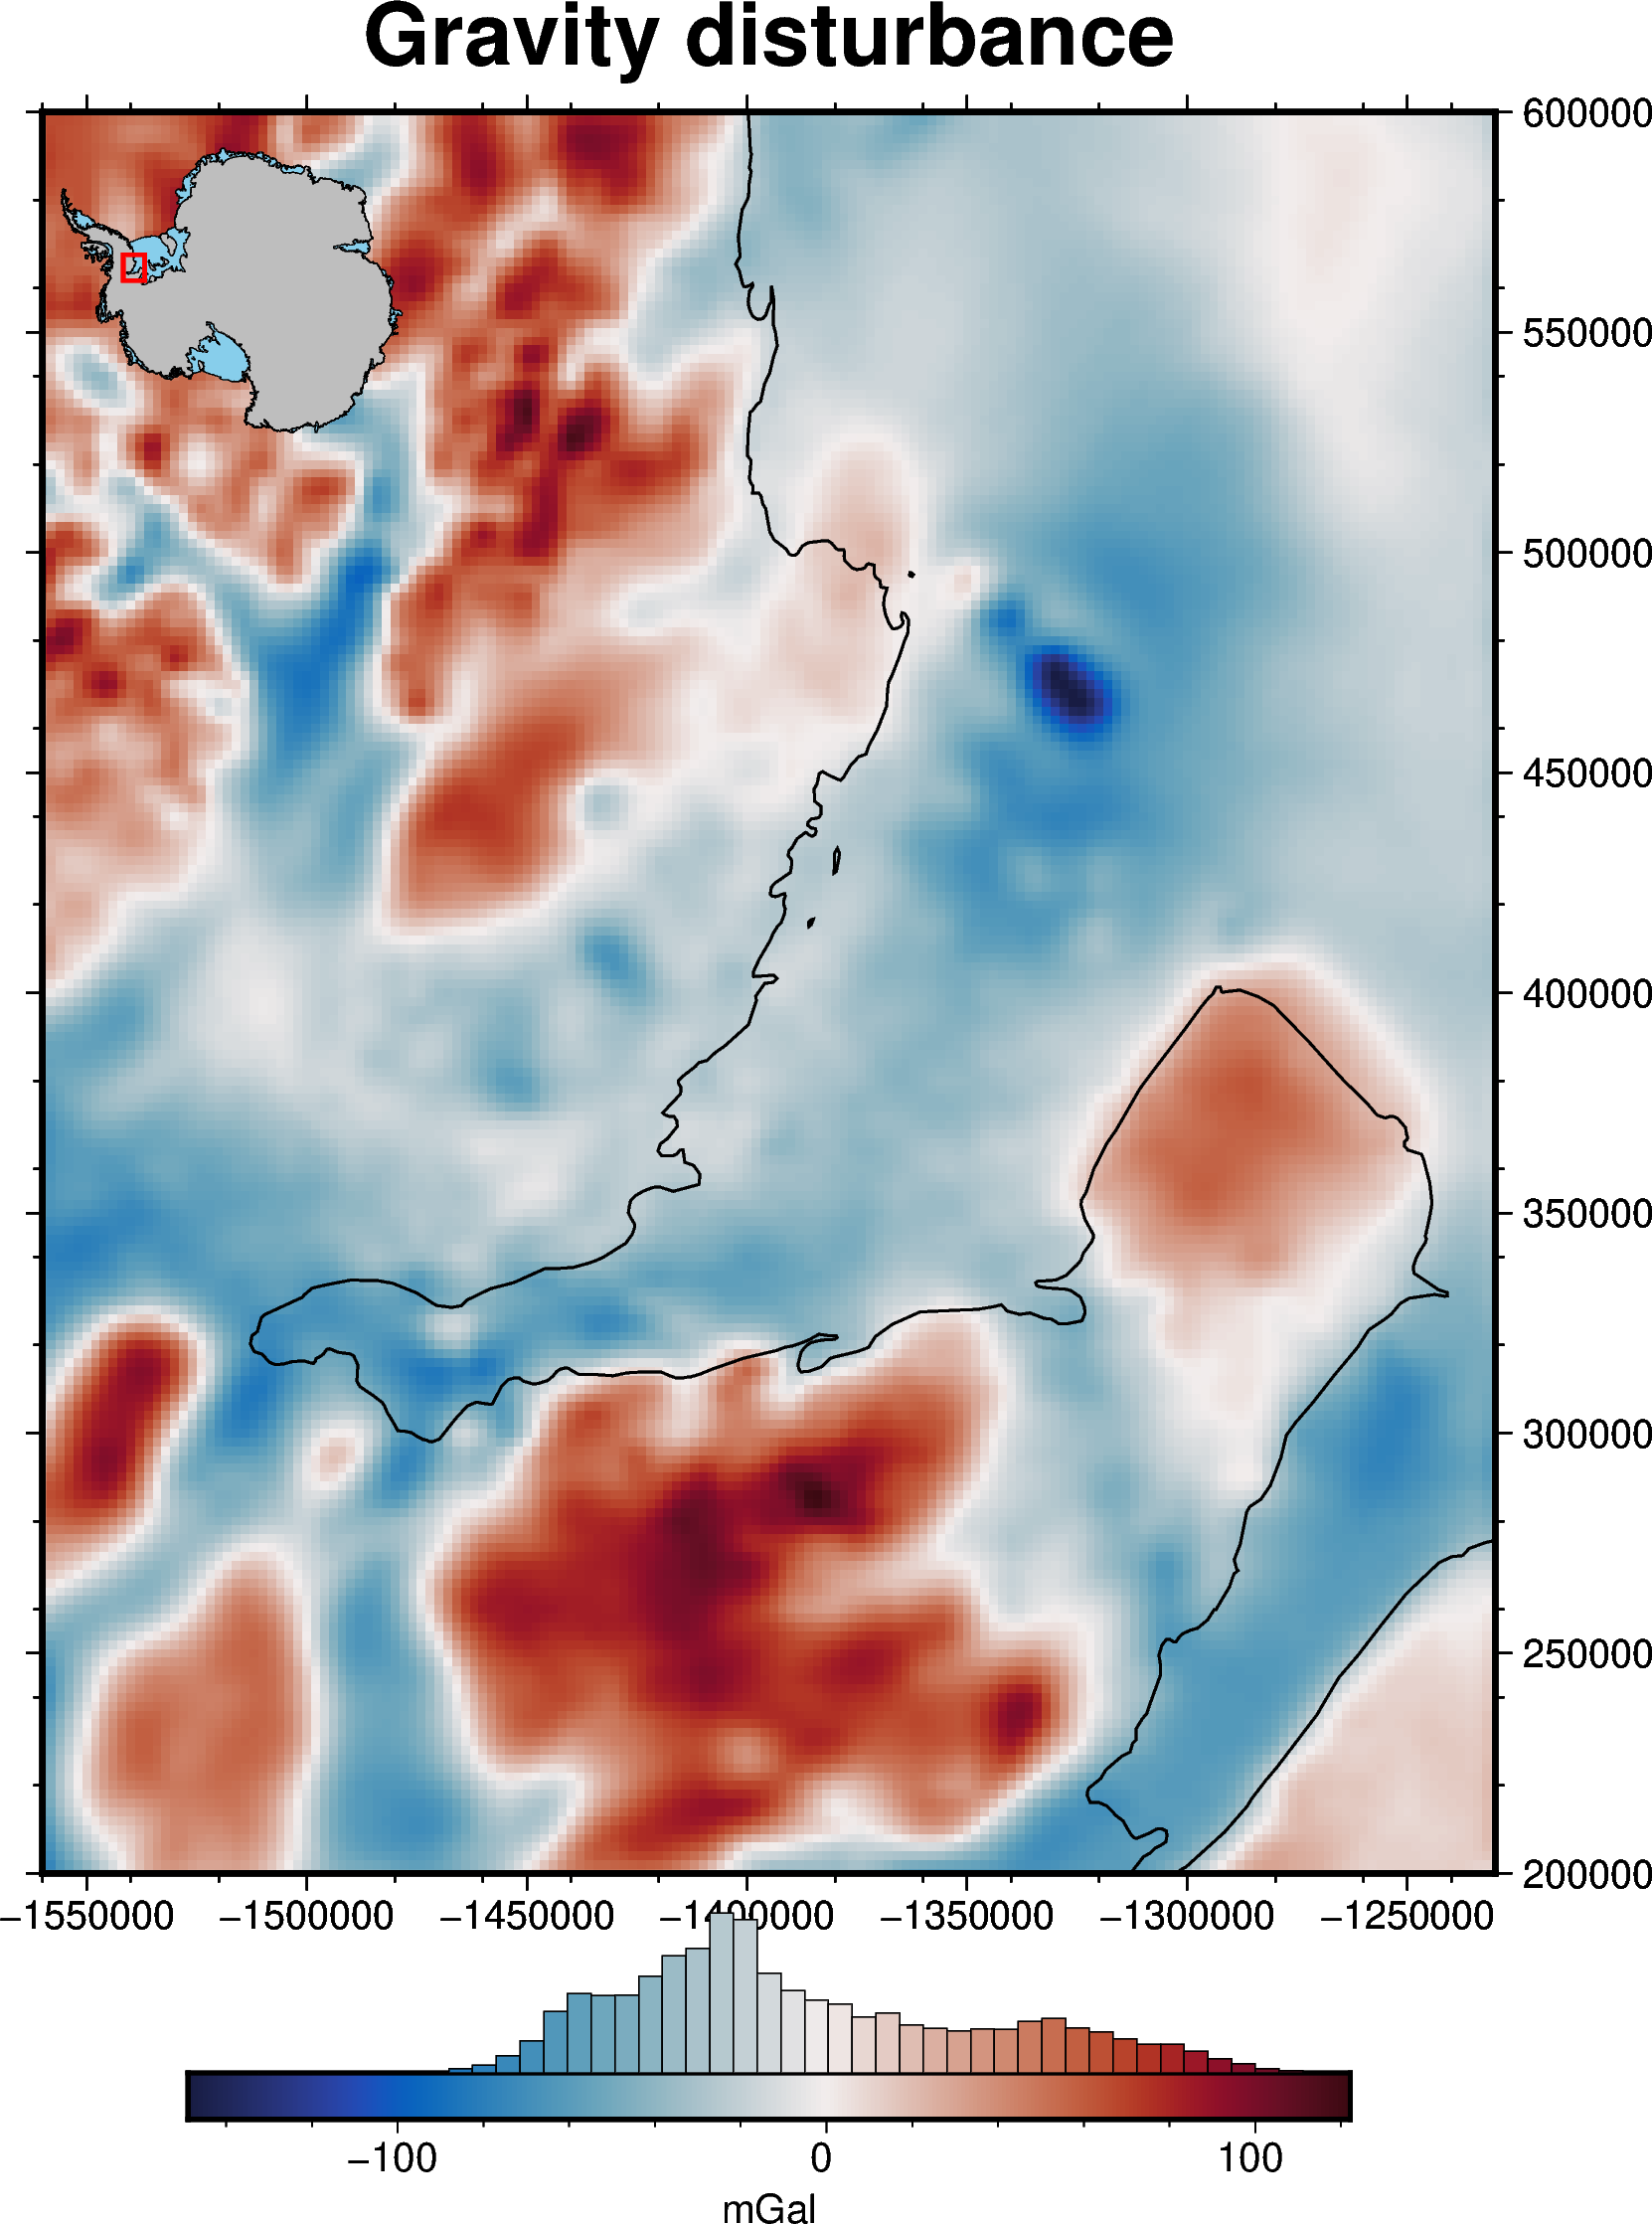
Here we will load the AntGG-2021 grid of gravity disturbances, an Antarcitc-wide gravity compilation consisting of ground, airborne, and satellite gravity observations.
[2]:
spacing = 2e3
# get ice shelf region
region = [-1560e3, -1230e3, 200e3, 600e3]
# add optional buffer
# region = ptk.alter_region(region, zoom=-20e3)
# change to nearest multiple of spacing
region = tuple([spacing * round(x / spacing) for x in region])
region
[2]:
(-1560000.0, -1230000.0, 200000.0, 600000.0)
[3]:
grav_data = ptk.fetch.gravity(
version="antgg-2021",
anomaly_type="DG",
region=region,
spacing=spacing,
)
# rename coordinates to easting and northing
grav_data = grav_data.rename({"x": "easting", "y": "northing"})
# rename elevation variable to upward
grav_data = grav_data.rename({"ellipsoidal_height": "upward"})
# initialize as invert4geom data object
grav_data = invert4geom.create_data(grav_data)
grav_data
requested spacing (2000.0) is smaller than the original (5000.0).
requested spacing (2000.0) is smaller than the original (5000.0).
[3]:
<xarray.Dataset> Size: 270kB
Dimensions: (northing: 201, easting: 166)
Coordinates:
* northing (northing) float64 2kB 2e+05 2.02e+05 ... 6e+05
* easting (easting) float64 1kB -1.56e+06 ... -1.23e+06
Data variables:
gravity_disturbance (northing, easting) float32 133kB -70.08 ... -15.39
upward (northing, easting) float32 133kB 838.4 860.9 ... 53.4
Attributes:
region: (-1560000.0, -1230000.0, 200000.0, 600000.0)
spacing: 2000.0
buffer_width: 32000.0
inner_region: (-1528000.0, -1262000.0, 232000.0, 568000.0)
dataset_type: data
model_type: prisms
coord_names: ('easting', 'northing')[4]:
fig = ptk.plot_grid(
grav_data.gravity_disturbance,
title="Gravity disturbance",
cmap="balance+h0",
cbar_label="mGal",
hist=True,
frame=["nSwE", "xaf20000", "yaf20000"],
coast=True,
inset=True,
)
fig.show()
ERROR 1: PROJ: proj_identify: Open of /home/mdtanker/invert4geom/.pixi/envs/default/share/proj failed
ERROR 1: PROJ: proj_identify: Open of /home/mdtanker/invert4geom/.pixi/envs/default/share/proj failed
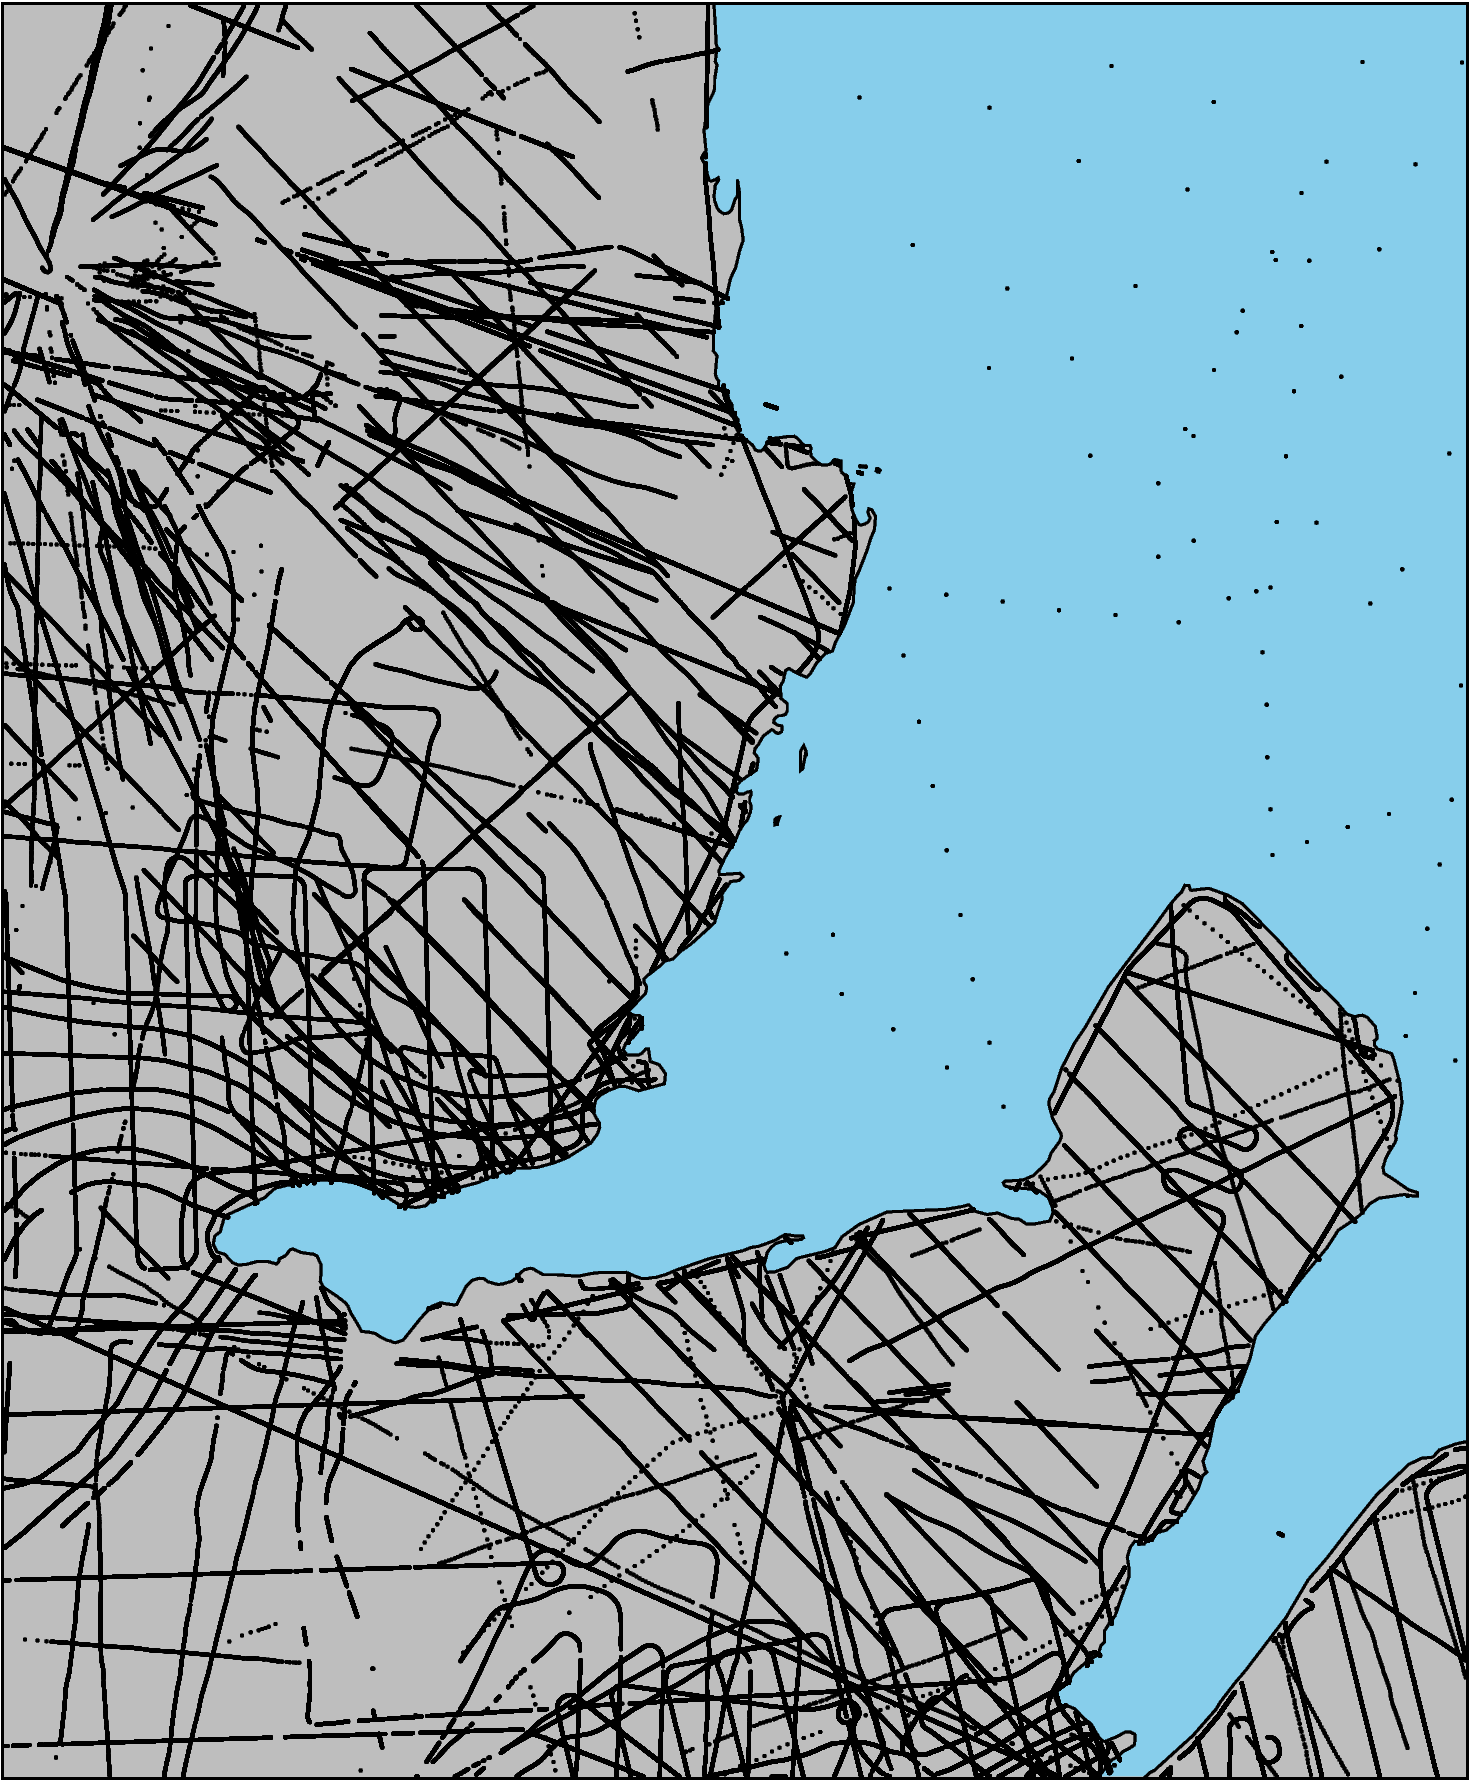
Get constraint points#
These are the locations where we know bathymetry or bed topography.
[5]:
bedmap_points = ptk.fetch.bedmap_points(version="all", region=region)
# rename bed elevation column
bedmap_points = bedmap_points.rename(columns={"bedrock_altitude (m)": "upward"})
bedmap_points = bedmap_points[bedmap_points.upward.notna()]
# drop points offshore including ice shelf
bedmap_mask = ptk.fetch.bedmap3(
layer="mask",
region=region,
)
# sample bedmap3 mask onto points
bedmap_points = invert4geom.sample_grids(
bedmap_points,
bedmap_mask,
"bedmap3_mask",
)
# drop points with mask value of 3 (floating ice)
bedmap_points = bedmap_points[~bedmap_points.bedmap3_mask.between(2, 4)]
bedmap_points
[5]:
| trajectory_id | trace_number | longitude (degree_east) | latitude (degree_north) | date | time_UTC | surface_altitude (m) | land_ice_thickness (m) | upward | two_way_travel_time (m) | aircraft_altitude (m) | along_track_distance (m) | easting | northing | project | geometry | bedmap_version | bedmap3_mask | |
|---|---|---|---|---|---|---|---|---|---|---|---|---|---|---|---|---|---|---|
| 0 | 62755 | NaN | -81.695210 | -76.970690 | NaN | NaN | 1044.00 | 1181.00 | -137.00 | NaN | NaN | NaN | -1.406645e+06 | 205327.458840 | NaN | POINT (-1406645.303 205327.459) | bedmap1 | 1.0 |
| 1 | 62754 | NaN | -81.679950 | -76.975200 | NaN | NaN | 1054.00 | 1029.00 | 24.00 | NaN | NaN | NaN | -1.406100e+06 | 205630.298820 | NaN | POINT (-1406099.635 205630.299) | bedmap1 | 1.0 |
| 2 | 62753 | NaN | -81.663100 | -76.983060 | NaN | NaN | 1076.00 | 920.00 | 156.00 | NaN | NaN | NaN | -1.405184e+06 | 205918.433319 | NaN | POINT (-1405183.553 205918.433) | bedmap1 | 1.0 |
| 3 | 62752 | NaN | -81.646150 | -76.987590 | NaN | NaN | 1093.00 | 1044.00 | 49.00 | NaN | NaN | NaN | -1.404630e+06 | 206261.722087 | NaN | POINT (-1404629.519 206261.722) | bedmap1 | 1.0 |
| 4 | 62751 | NaN | -81.580090 | -77.020260 | NaN | NaN | 1127.00 | 958.00 | 169.00 | NaN | NaN | NaN | -1.400836e+06 | 207354.832127 | NaN | POINT (-1400835.628 207354.832) | bedmap1 | 1.0 |
| ... | ... | ... | ... | ... | ... | ... | ... | ... | ... | ... | ... | ... | ... | ... | ... | ... | ... | ... |
| 192550 | 2016102603010 | NaN | -69.999224 | -76.252267 | 2016-10-26 | 16:25:31 | 371.02 | 365.76 | 5.27 | NaN | NaN | NaN | -1.410136e+06 | 513269.246586 | NASA_2016_ICEBRIDGE_AIR_BM3 | POINT (-1410136.241 513269.247) | bedmap3 | 1.0 |
| 192551 | 2016102603010 | NaN | -69.999227 | -76.252401 | 2016-10-26 | 16:25:31 | 370.74 | 359.20 | 11.54 | NaN | NaN | NaN | -1.410122e+06 | 513264.123479 | NASA_2016_ICEBRIDGE_AIR_BM3 | POINT (-1410122.395 513264.123) | bedmap3 | 1.0 |
| 192552 | 2016102603010 | NaN | -69.999229 | -76.252535 | 2016-10-26 | 16:25:31 | 369.72 | 351.08 | 18.65 | NaN | NaN | NaN | -1.410109e+06 | 513259.024985 | NASA_2016_ICEBRIDGE_AIR_BM3 | POINT (-1410108.541 513259.025) | bedmap3 | 1.0 |
| 192553 | 2016102603010 | NaN | -69.999231 | -76.252669 | 2016-10-26 | 16:25:32 | 368.33 | 342.83 | 25.50 | NaN | NaN | NaN | -1.410095e+06 | 513253.926494 | NASA_2016_ICEBRIDGE_AIR_BM3 | POINT (-1410094.687 513253.926) | bedmap3 | 1.0 |
| 192554 | 2016102603010 | NaN | -69.999233 | -76.252804 | 2016-10-26 | 16:25:32 | 367.95 | 336.03 | 31.92 | NaN | NaN | NaN | -1.410081e+06 | 513248.790324 | NASA_2016_ICEBRIDGE_AIR_BM3 | POINT (-1410080.729 513248.79) | bedmap3 | 1.0 |
591369 rows × 18 columns
[6]:
# get ibcso point data coverage (should include polygons as well eventually)
ibcso_points = ptk.fetch.ibcso_coverage(region=region)[0]
ibcso_points
[6]:
| dataset_name | dataset_tid | weight | geometry | easting | northing | |
|---|---|---|---|---|---|---|
| 0 | RONNE_9495_seismic_PS65.xyz | 12 | 10 | POINT (-1245375.956 357152.352) | -1.245376e+06 | 357152.351846 |
| 0 | RONNE_9495_seismic_PS65.xyz | 12 | 10 | POINT (-1232402.737 361687.672) | -1.232403e+06 | 361687.671643 |
| 0 | RONNE_9495_seismic_PS65.xyz | 12 | 10 | POINT (-1243579.79 367255.787) | -1.243580e+06 | 367255.787038 |
| 0 | RONNE_9495_seismic_PS65.xyz | 12 | 10 | POINT (-1241471.336 376974.475) | -1.241471e+06 | 376974.475253 |
| 0 | RONNE_9495_seismic_PS65.xyz | 12 | 10 | POINT (-1238705.648 391465.251) | -1.238706e+06 | 391465.250636 |
| ... | ... | ... | ... | ... | ... | ... |
| 1 | Russian_FilchnerRonne_seismic_PS65.xyz | 12 | 10 | POINT (-1292828.423 558340.322) | -1.292828e+06 | 558340.321893 |
| 1 | Russian_FilchnerRonne_seismic_PS65.xyz | 12 | 10 | POINT (-1261438.377 564620.78) | -1.261438e+06 | 564620.780496 |
| 1 | Russian_FilchnerRonne_seismic_PS65.xyz | 12 | 10 | POINT (-1286913.321 578136.932) | -1.286913e+06 | 578136.931576 |
| 1 | Russian_FilchnerRonne_seismic_PS65.xyz | 12 | 10 | POINT (-1253337.259 587150.42) | -1.253337e+06 | 587150.420426 |
| 1 | Russian_FilchnerRonne_seismic_PS65.xyz | 12 | 10 | POINT (-1230887.222 587058.571) | -1.230887e+06 | 587058.571015 |
76 rows × 6 columns
[7]:
# merge ibcso and bedmap points
constraints = pd.concat(
[bedmap_points[["easting", "northing"]], ibcso_points[["easting", "northing"]]]
)
constraints
[7]:
| easting | northing | |
|---|---|---|
| 0 | -1.406645e+06 | 205327.458840 |
| 1 | -1.406100e+06 | 205630.298820 |
| 2 | -1.405184e+06 | 205918.433319 |
| 3 | -1.404630e+06 | 206261.722087 |
| 4 | -1.400836e+06 | 207354.832127 |
| ... | ... | ... |
| 1 | -1.292828e+06 | 558340.321893 |
| 1 | -1.261438e+06 | 564620.780496 |
| 1 | -1.286913e+06 | 578136.931576 |
| 1 | -1.253337e+06 | 587150.420426 |
| 1 | -1.230887e+06 | 587058.571015 |
591445 rows × 2 columns
Above we found the locations of point measurements of bathymetry / bed topography. Some of these points doesn’t include the actual depths, just the coordinates. For simplicity, for all the points we will just sample the elevations from the Bedmap bed topography grid. Ideally, all constraint points would have actual measured elevations, to exclude errors during the interpolation of the Bedmap grid.
[8]:
# get grid of bedmap bed elevations
bedmap_bed = ptk.fetch.bedmap3(
layer="bed",
reference="ellipsoid",
region=region,
spacing=spacing,
)
bedmap_bed = bedmap_bed.to_dataset(name="upward").rename(
{"x": "easting", "y": "northing"}
)
# sample bedmap bed topography at the constraints
constraints = invert4geom.sample_grids(
constraints,
bedmap_bed.upward,
"upward",
)
constraints
[8]:
| easting | northing | upward | |
|---|---|---|---|
| 0 | -1.406645e+06 | 205327.458840 | -3.740680 |
| 1 | -1.406100e+06 | 205630.298820 | -25.163422 |
| 2 | -1.405184e+06 | 205918.433319 | -61.425190 |
| 3 | -1.404630e+06 | 206261.722087 | -60.910007 |
| 4 | -1.400836e+06 | 207354.832127 | 84.954871 |
| ... | ... | ... | ... |
| 1 | -1.292828e+06 | 558340.321893 | -906.429578 |
| 1 | -1.261438e+06 | 564620.780496 | -597.208431 |
| 1 | -1.286913e+06 | 578136.931576 | -779.597610 |
| 1 | -1.253337e+06 | 587150.420426 | -638.752290 |
| 1 | -1.230887e+06 | 587058.571015 | -713.711744 |
591445 rows × 3 columns
[9]:
fig = ptk.basemap(
region=region,
points=constraints,
points_style="p1p",
coast=True,
simple_basemap=True,
)
fig.show()
ERROR 1: PROJ: proj_identify: Open of /home/mdtanker/invert4geom/.pixi/envs/default/share/proj failed
ERROR 1: PROJ: proj_identify: Open of /home/mdtanker/invert4geom/.pixi/envs/default/share/proj failed
ERROR 1: PROJ: proj_identify: Open of /home/mdtanker/invert4geom/.pixi/envs/default/share/proj failed
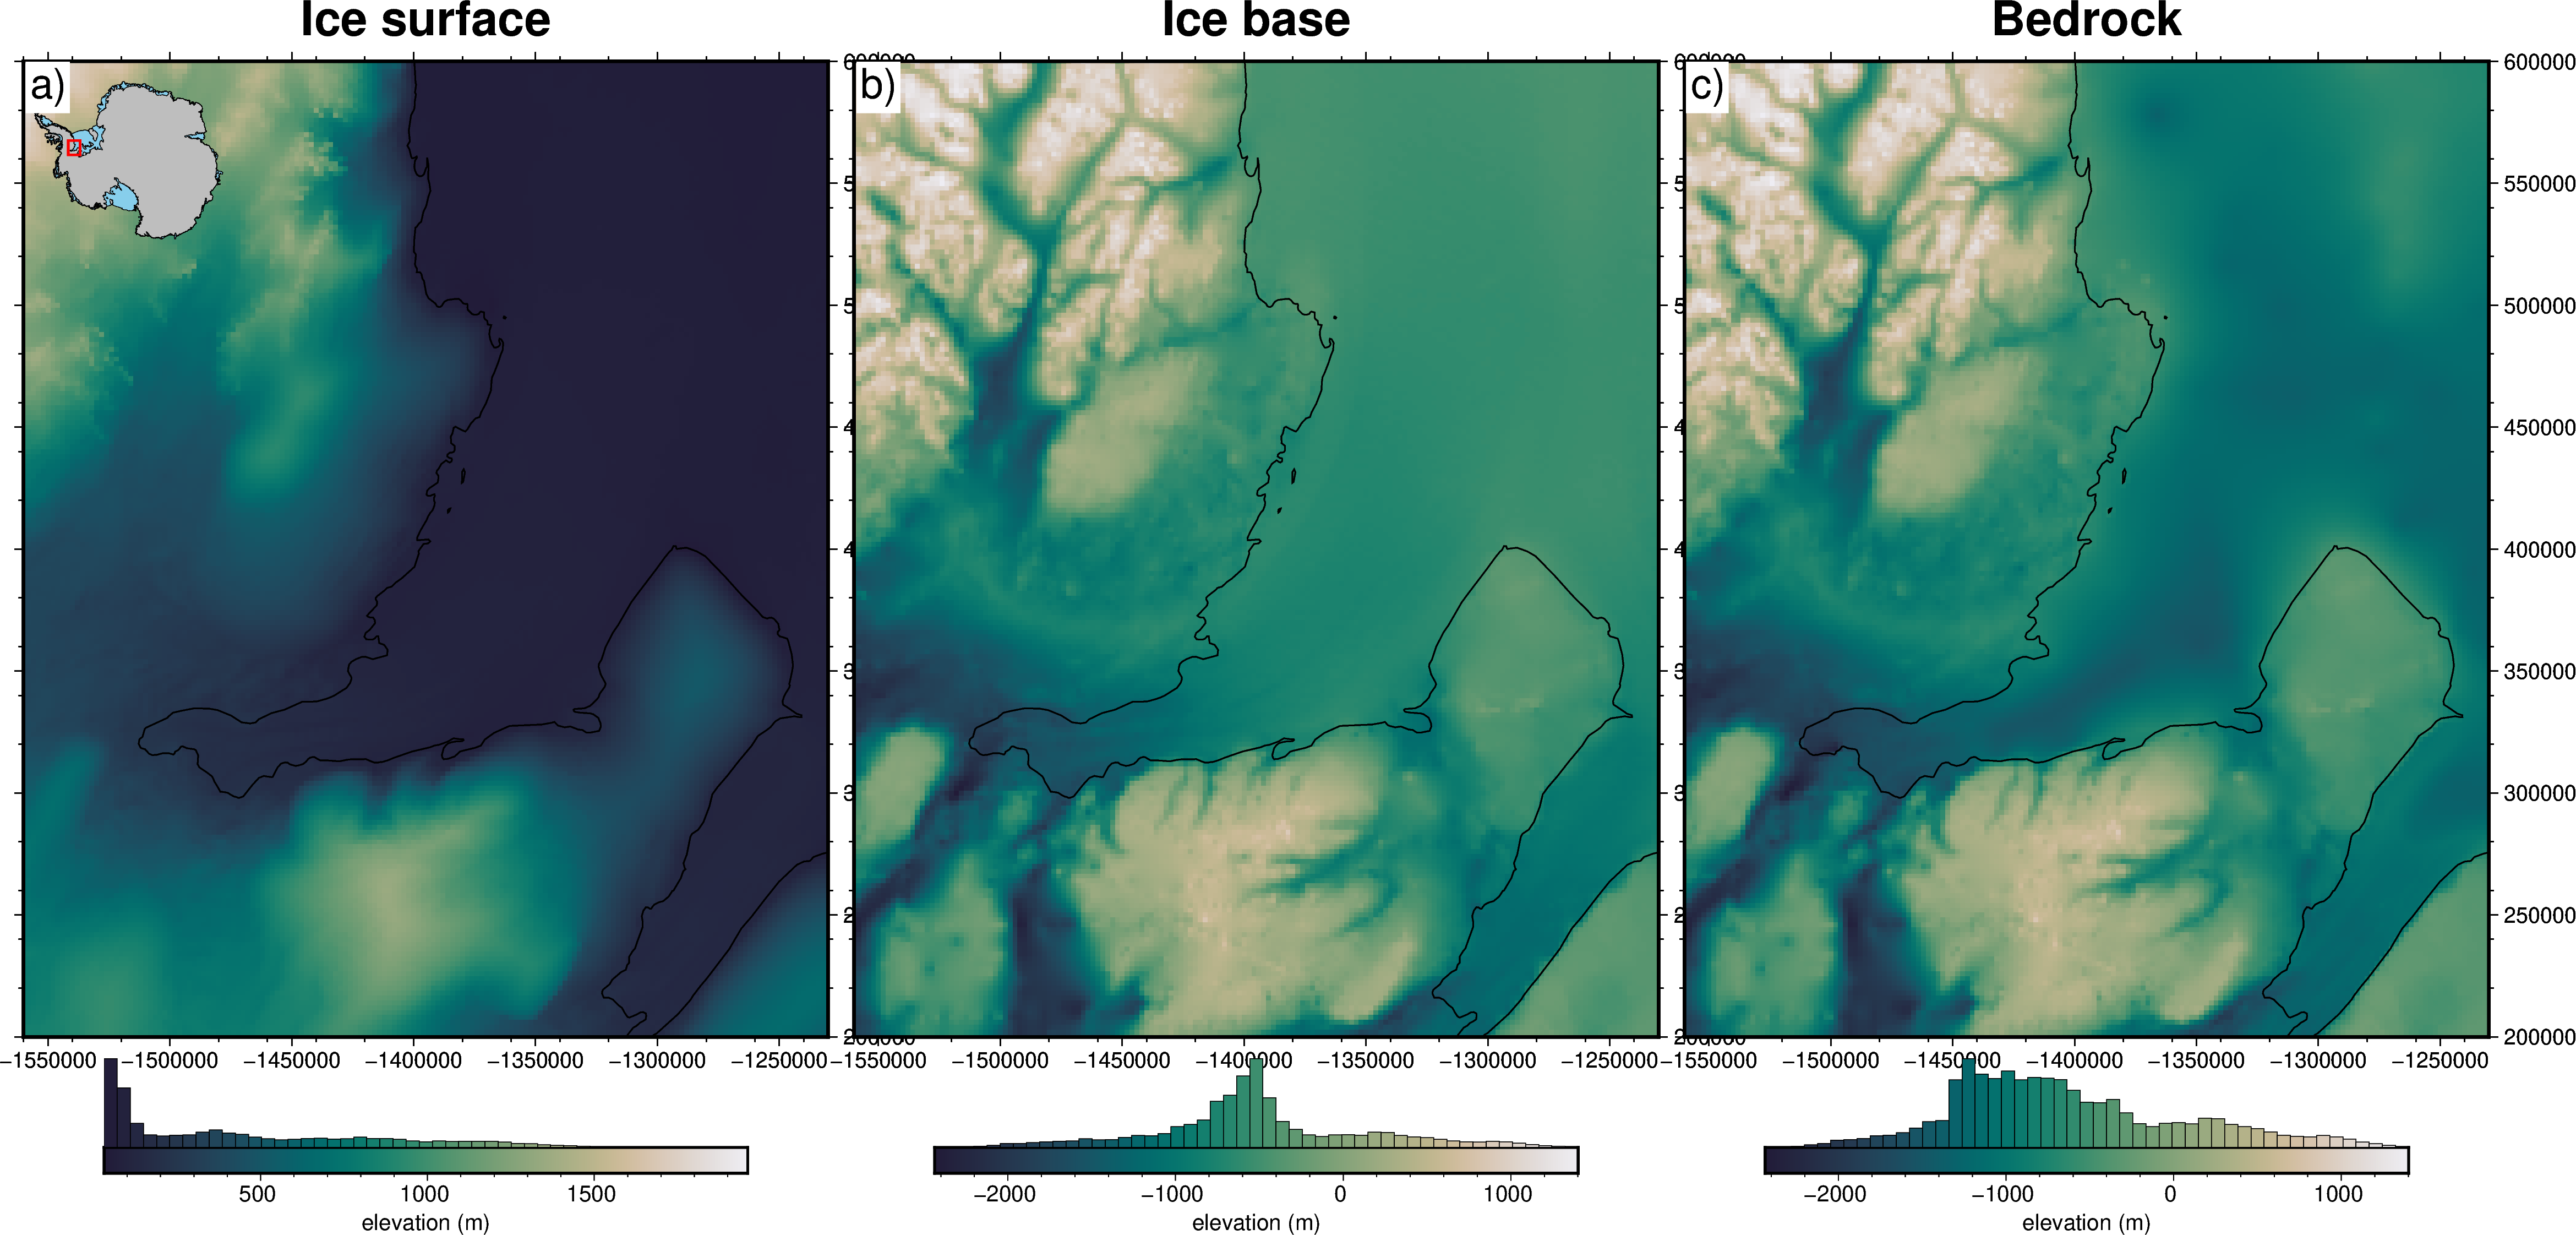
Get topography grids#
Here we will load topography grids of ice surface and ice base from Bedmap.
[10]:
ice_surface = ptk.fetch.bedmap3(
layer="surface",
reference="ellipsoid",
region=region,
spacing=spacing,
fill_nans=True,
)
water_surface = ptk.fetch.bedmap3(
layer="icebase",
reference="ellipsoid",
region=region,
spacing=spacing,
fill_nans=True,
)
[11]:
# rename coordinates and make into datasets
ice_surface = ice_surface.to_dataset(name="upward").rename(
{"x": "easting", "y": "northing"}
)
water_surface = water_surface.to_dataset(name="upward").rename(
{"x": "easting", "y": "northing"}
)
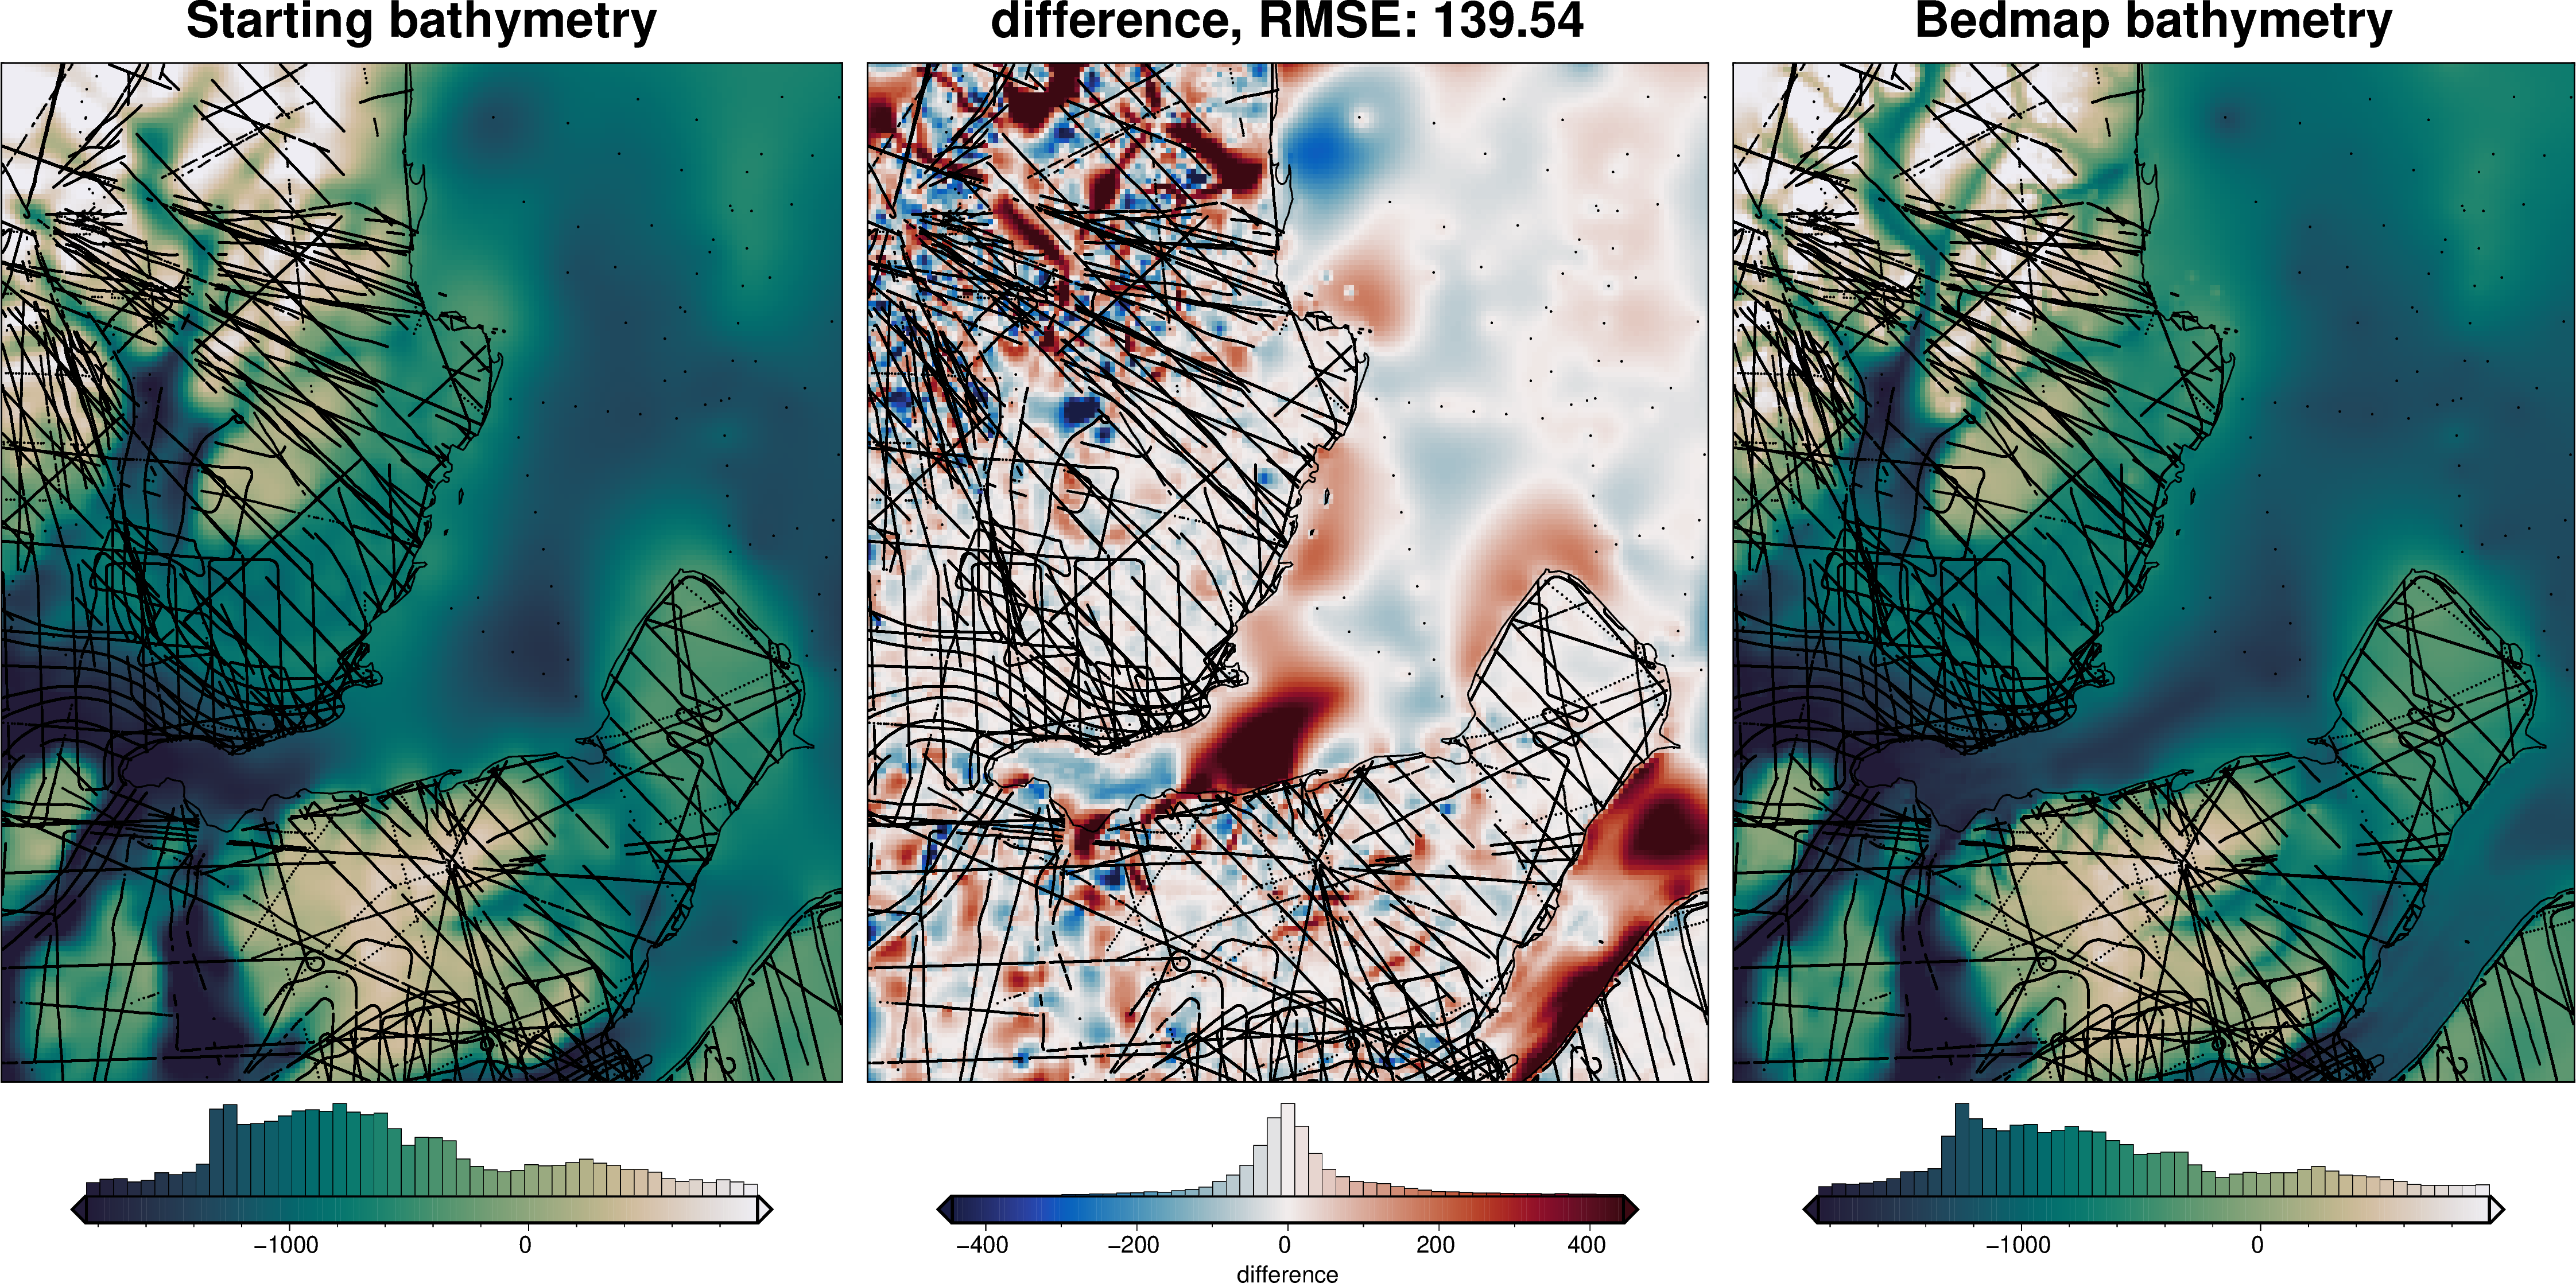
Create starting bathymetry grid#
Here we will interpolated the compiled point measurements of bed topography / bathymetry to create the starting topography grid.
[12]:
# grid the sampled values using verde
import numpy as np
starting_topography_kwargs = dict(
method="splines",
region=region,
spacing=spacing,
block_size=spacing * 2,
constraints_df=constraints,
dampings=np.logspace(-20, 0, 10),
# dampings=None,
# upper_confining_layer=water_surface.upward,
)
bed = invert4geom.create_topography(**starting_topography_kwargs)
_ = ptk.grid_compare(
bed.upward,
bedmap_bed.upward,
grid1_name="Starting bathymetry",
grid2_name="Bedmap bathymetry",
robust=True,
hist=True,
inset=False,
verbose="q",
title="difference",
reverse_cpt=True,
cmap="rain",
points=constraints,
points_style="p1p",
coast=True,
)
[13]:
bed = bedmap_bed
[14]:
fig = ptk.subplots(
[ice_surface.upward, water_surface.upward, bed.upward],
titles=["Ice surface", "Ice base", "Bedrock"],
reverse_cpt=True,
cmap="rain",
cbar_label="elevation (m)",
hist=True,
frame=["nSwE", "xaf20000", "yaf20000"],
coast=True,
insets=[True, False, False],
)
fig.show()
ERROR 1: PROJ: proj_identify: Open of /home/mdtanker/invert4geom/.pixi/envs/default/share/proj failed
ERROR 1: PROJ: proj_identify: Open of /home/mdtanker/invert4geom/.pixi/envs/default/share/proj failed
Correct for ice and water surface gravity effects#
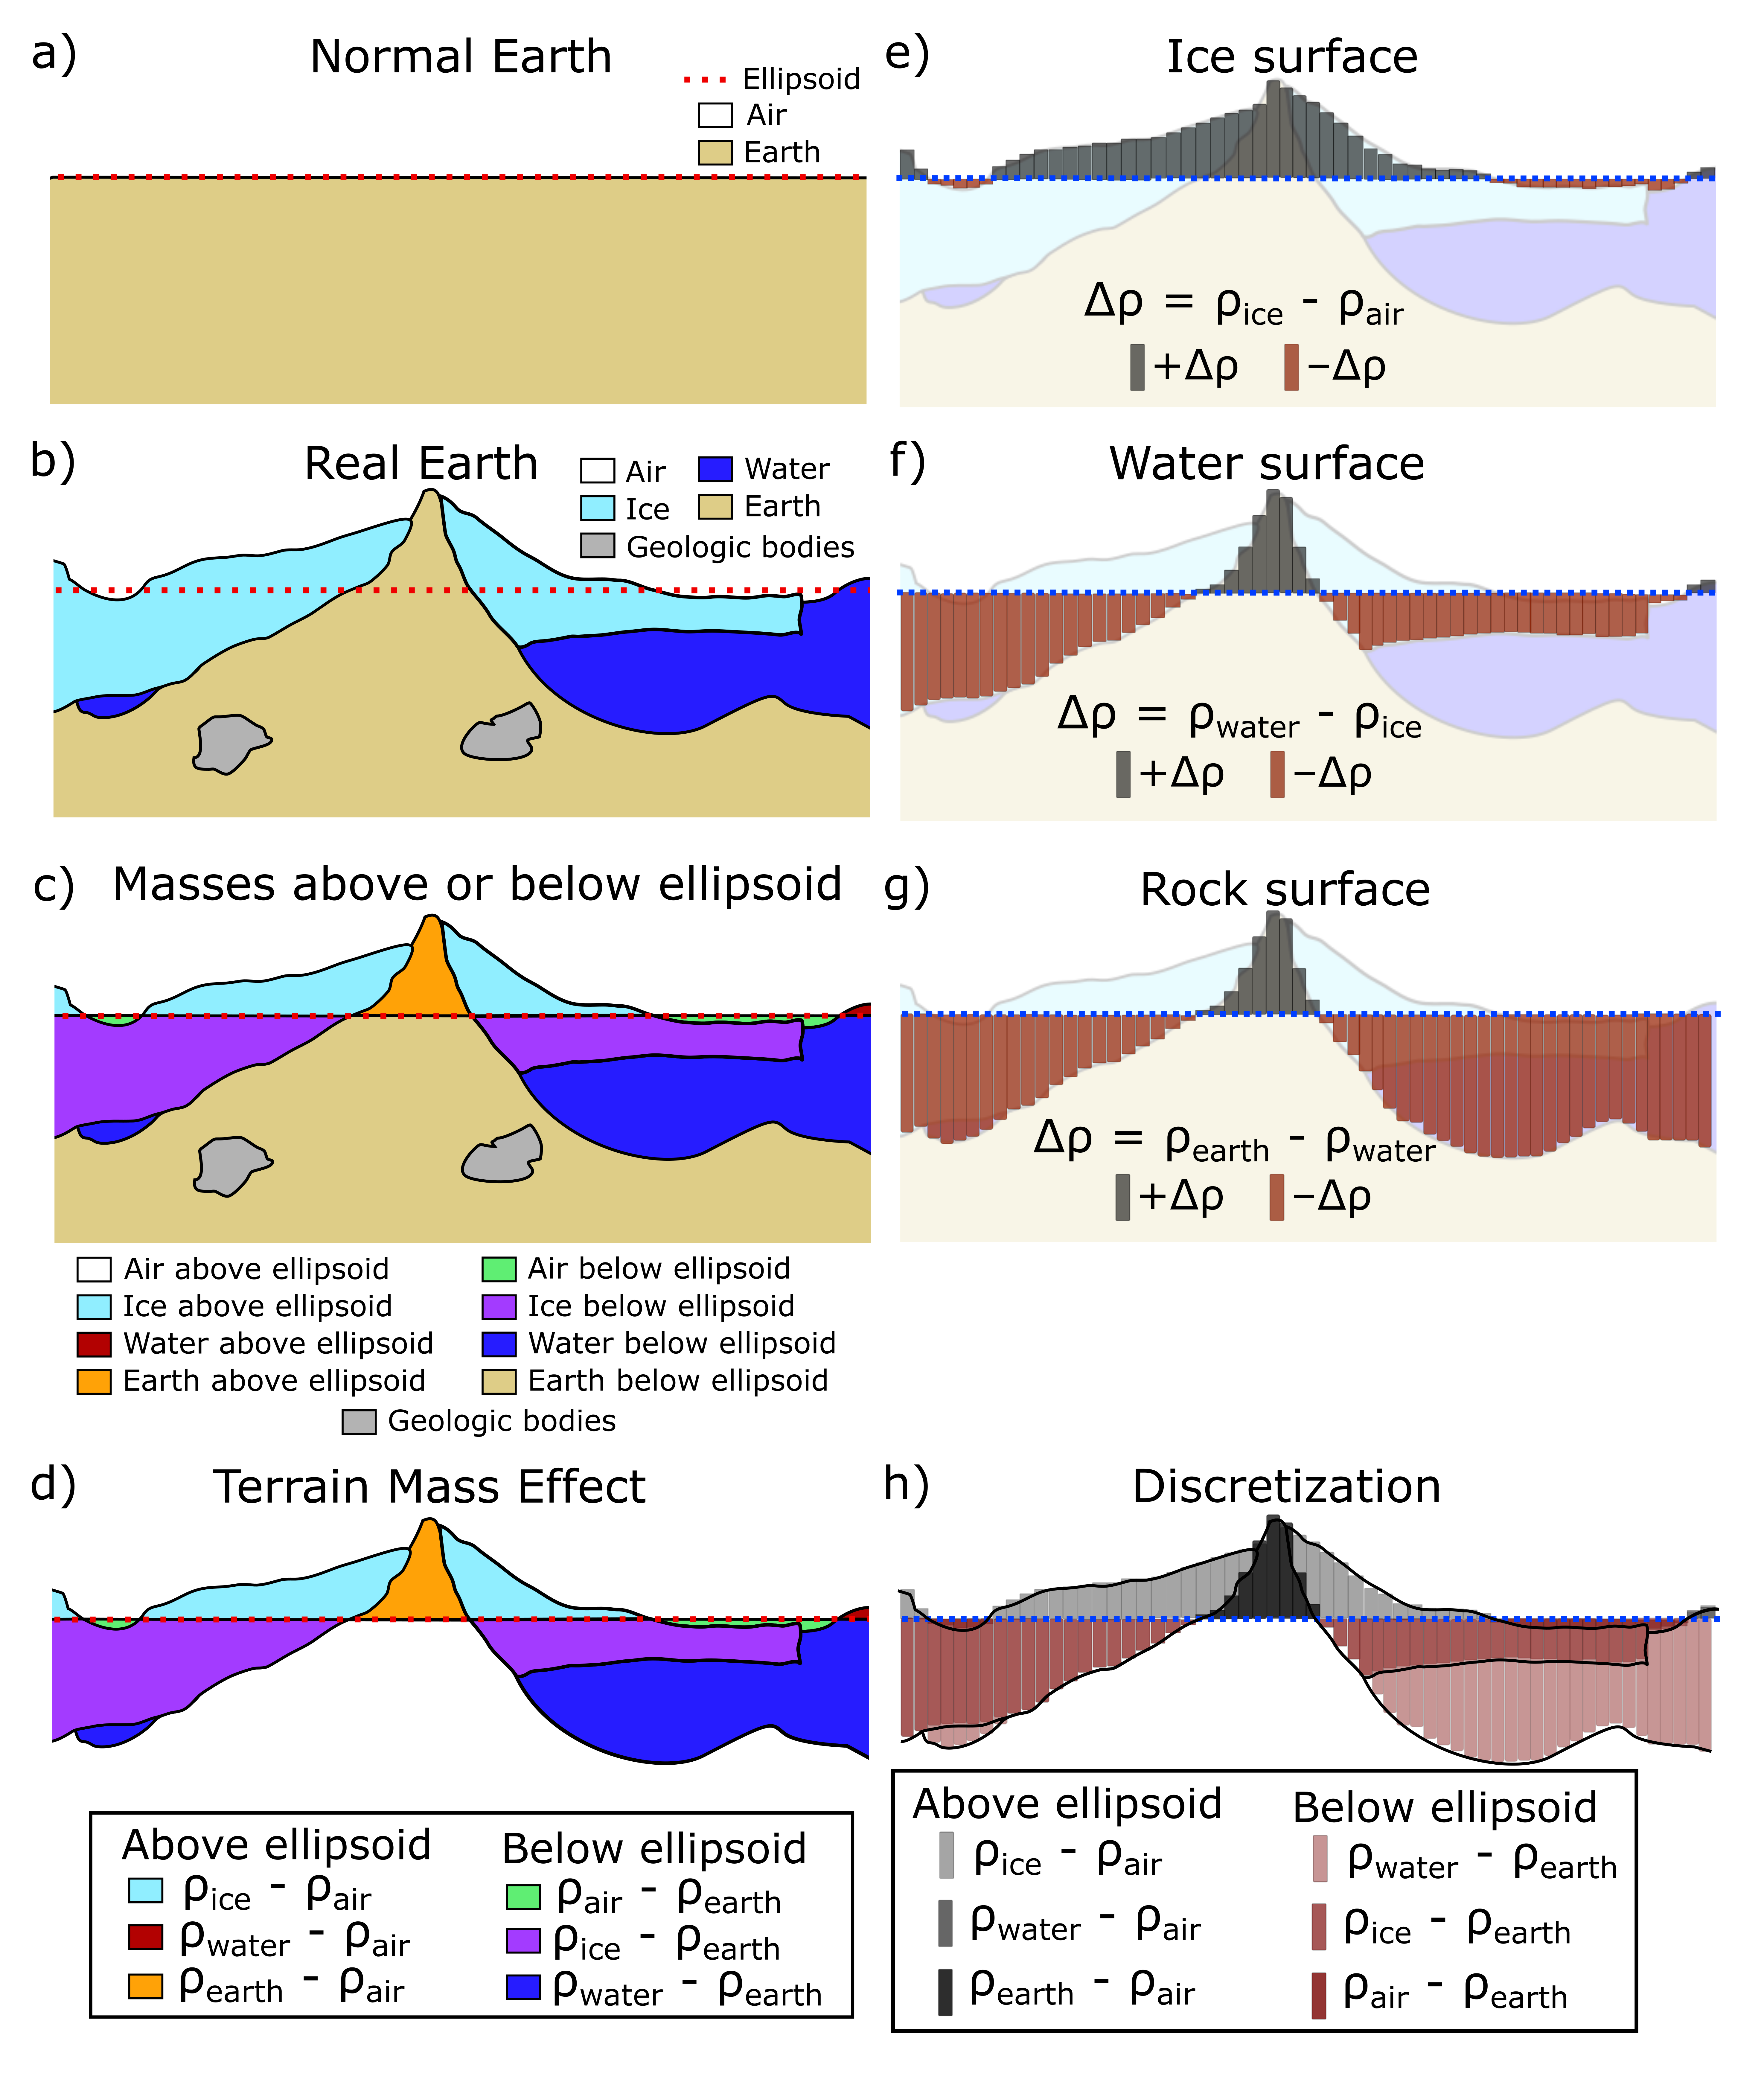
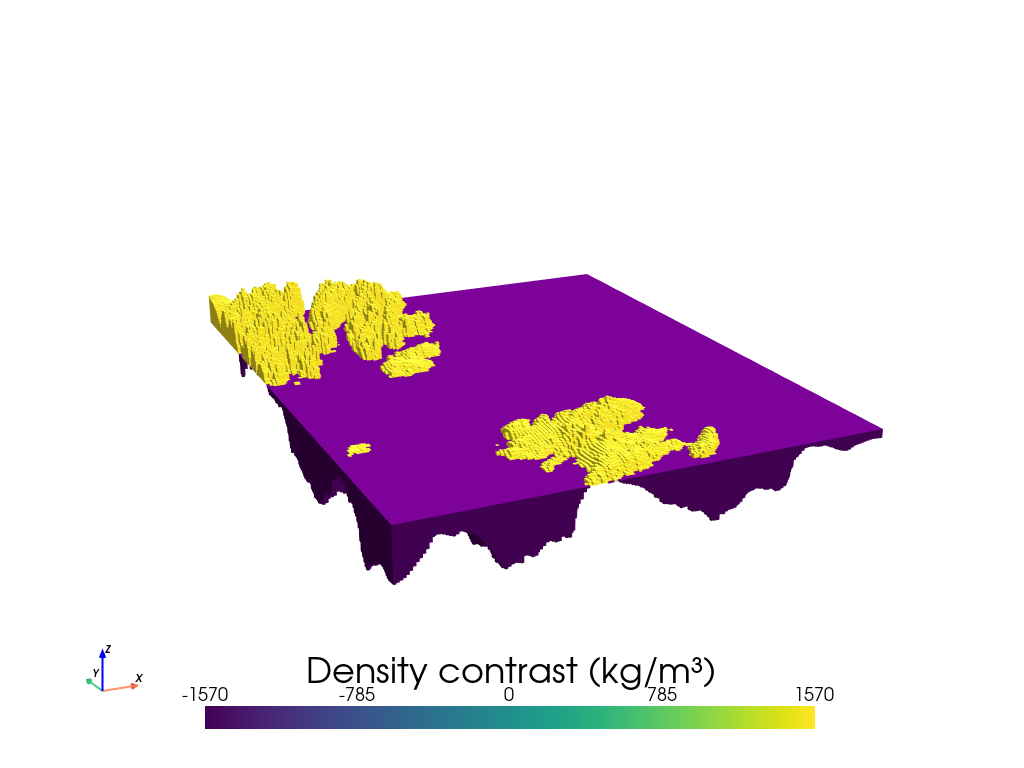
To forward model the gravity effect of some topography surface (e.g. rock topography, Moho, bathymetry), Invert4Geom uses a density contrast approach to discretization, as opposed to a absolute density approach. This approach uses a single layer of prisms, with density values of the density contrast between the medium’s above and below the surface. As an example, to model the gravity effect of bathymetry, the model elements (prisms or tesseroids) can be assigned a density of +600 kg/m3 (3300 kg/m3 - 2700 kg/m3) for elements above a reference level, and -600 kg/m3 for elements below the reference level.
With this approach, any corrections for terrain or topography gravity effects should use this convention as well. In this example of a sub-ice shelf bathymetry model, prior to the inversion the gravity disturbance, or free-air anomaly data should be corrected for the gravity effects of the density contrast across the ice surface, and the ice base / water surface. Using the setup from the below figures, calculating and correcting for the gravity effects of ice and water surface (e and f) means that during the inversion, their gravity effects do not need to be recalculated at each iteration. Instead, if an absolute density approach was used, at each iteration the gravity effect of the water layer and the ice layer would need to be recalculated as the bathymetry models changes.
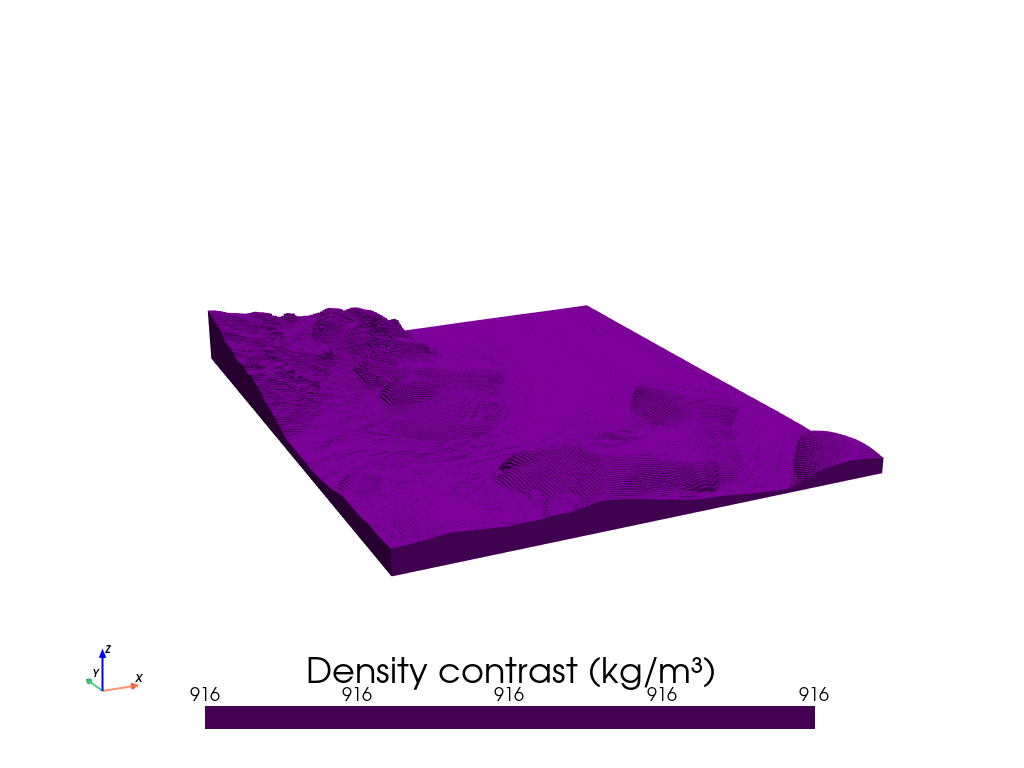
[15]:
# create model object
ice_surface_model = invert4geom.create_model(
zref=0,
density_contrast=917 - 1, # ice - air in kg/m3
topography=ice_surface,
)
ice_surface_model.inv.plot_model(
color_by="density",
zscale=20,
)
[16]:
# create model object
water_surface_model = invert4geom.create_model(
zref=0,
density_contrast=1030 - 917, # water - ice in kg/m3
topography=water_surface,
)
# water_surface_model.inv.plot_model(
# color_by="density",
# zscale=20,
# )
[17]:
# calculate gravity effect of models
grav_data.inv.forward_gravity(
ice_surface_model,
name="ice_surface",
progressbar=True,
)
grav_data.inv.forward_gravity(
water_surface_model,
name="water_surface",
progressbar=True,
)
grav_data
[17]:
<xarray.Dataset> Size: 804kB
Dimensions: (northing: 201, easting: 166)
Coordinates:
* northing (northing) float64 2kB 2e+05 2.02e+05 ... 6e+05
* easting (easting) float64 1kB -1.56e+06 ... -1.23e+06
Data variables:
gravity_disturbance (northing, easting) float32 133kB -70.08 ... -15.39
upward (northing, easting) float32 133kB 838.4 860.9 ... 53.4
ice_surface (northing, easting) float64 267kB 25.49 27.46 ... 1.983
water_surface (northing, easting) float64 267kB -3.829 ... -1.811
Attributes:
region: (-1560000.0, -1230000.0, 200000.0, 600000.0)
spacing: 2000.0
buffer_width: 32000.0
inner_region: (-1528000.0, -1262000.0, 232000.0, 568000.0)
dataset_type: data
model_type: prisms
coord_names: ('easting', 'northing')[18]:
fig = ptk.subplots(
[grav_data.ice_surface, grav_data.water_surface],
titles=["Ice surface gravity", "Water surface gravity"],
cmap="balance+h0",
cbar_label="mGal",
hist=True,
frame=["nSwE", "xaf20000", "yaf20000"],
coast=True,
insets=[True, False],
absolute=True,
)
fig.show()
ERROR 1: PROJ: proj_identify: Open of /home/mdtanker/invert4geom/.pixi/envs/default/share/proj failed
ERROR 1: PROJ: proj_identify: Open of /home/mdtanker/invert4geom/.pixi/envs/default/share/proj failed
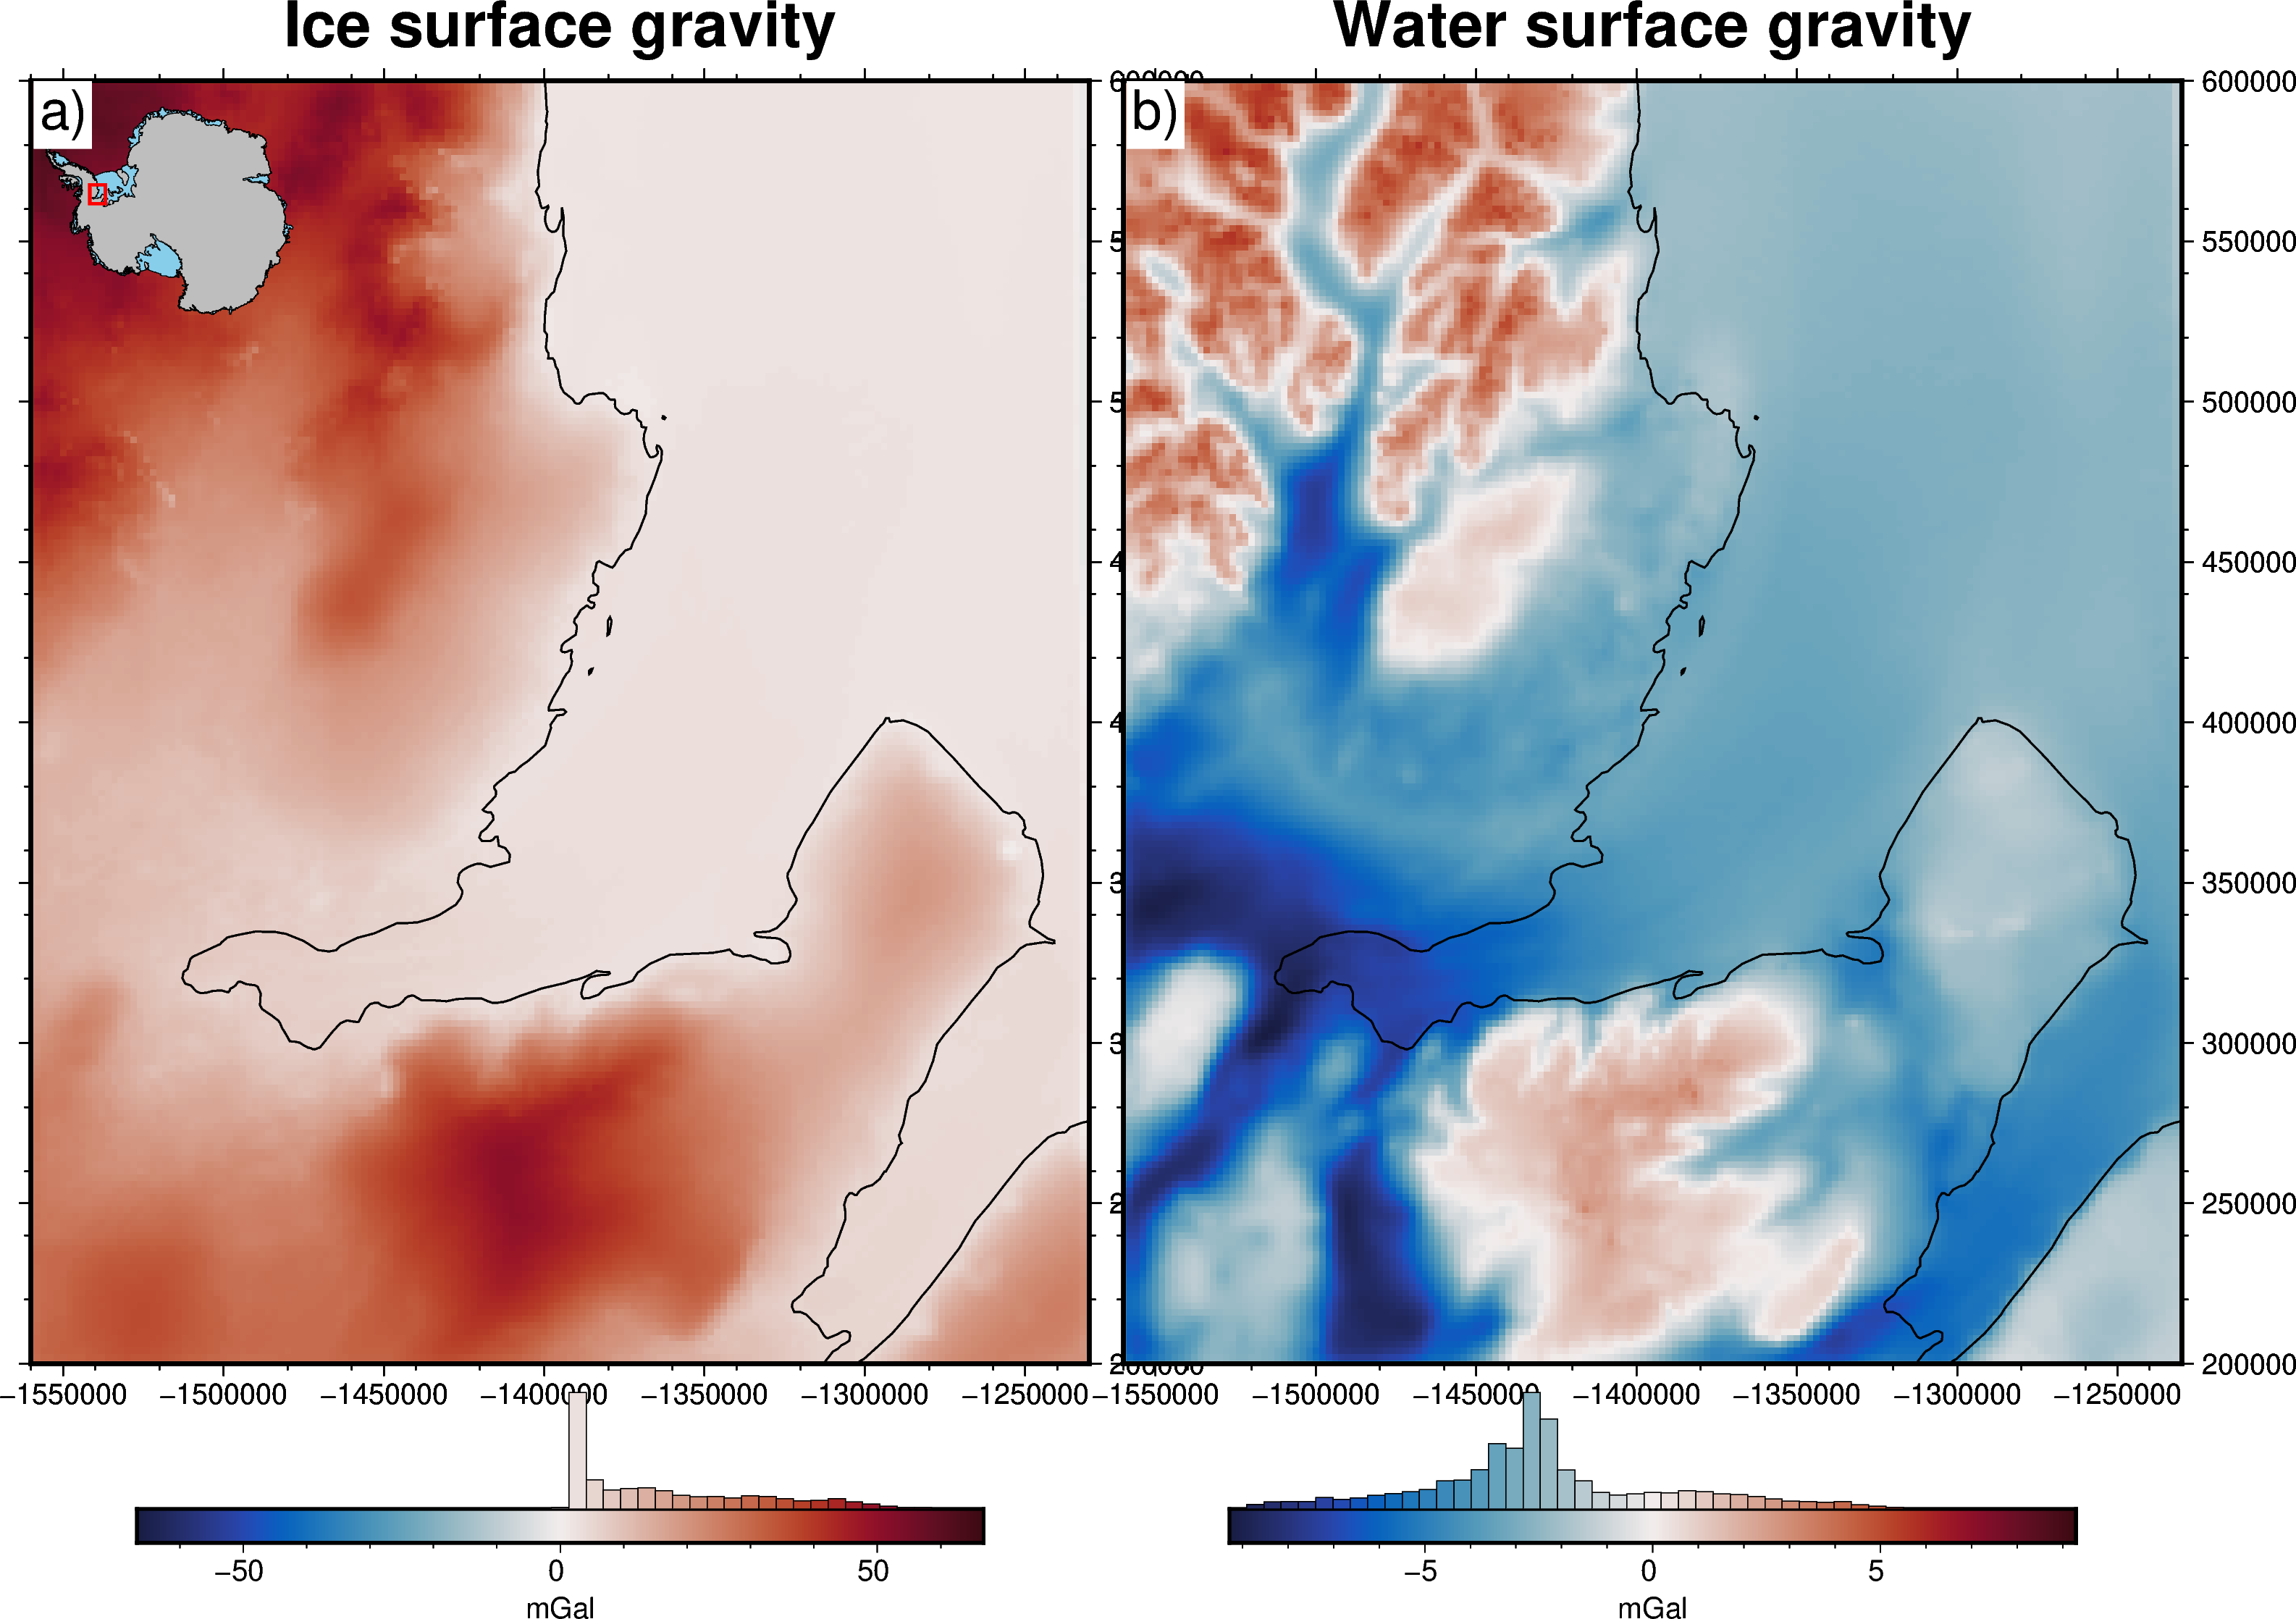
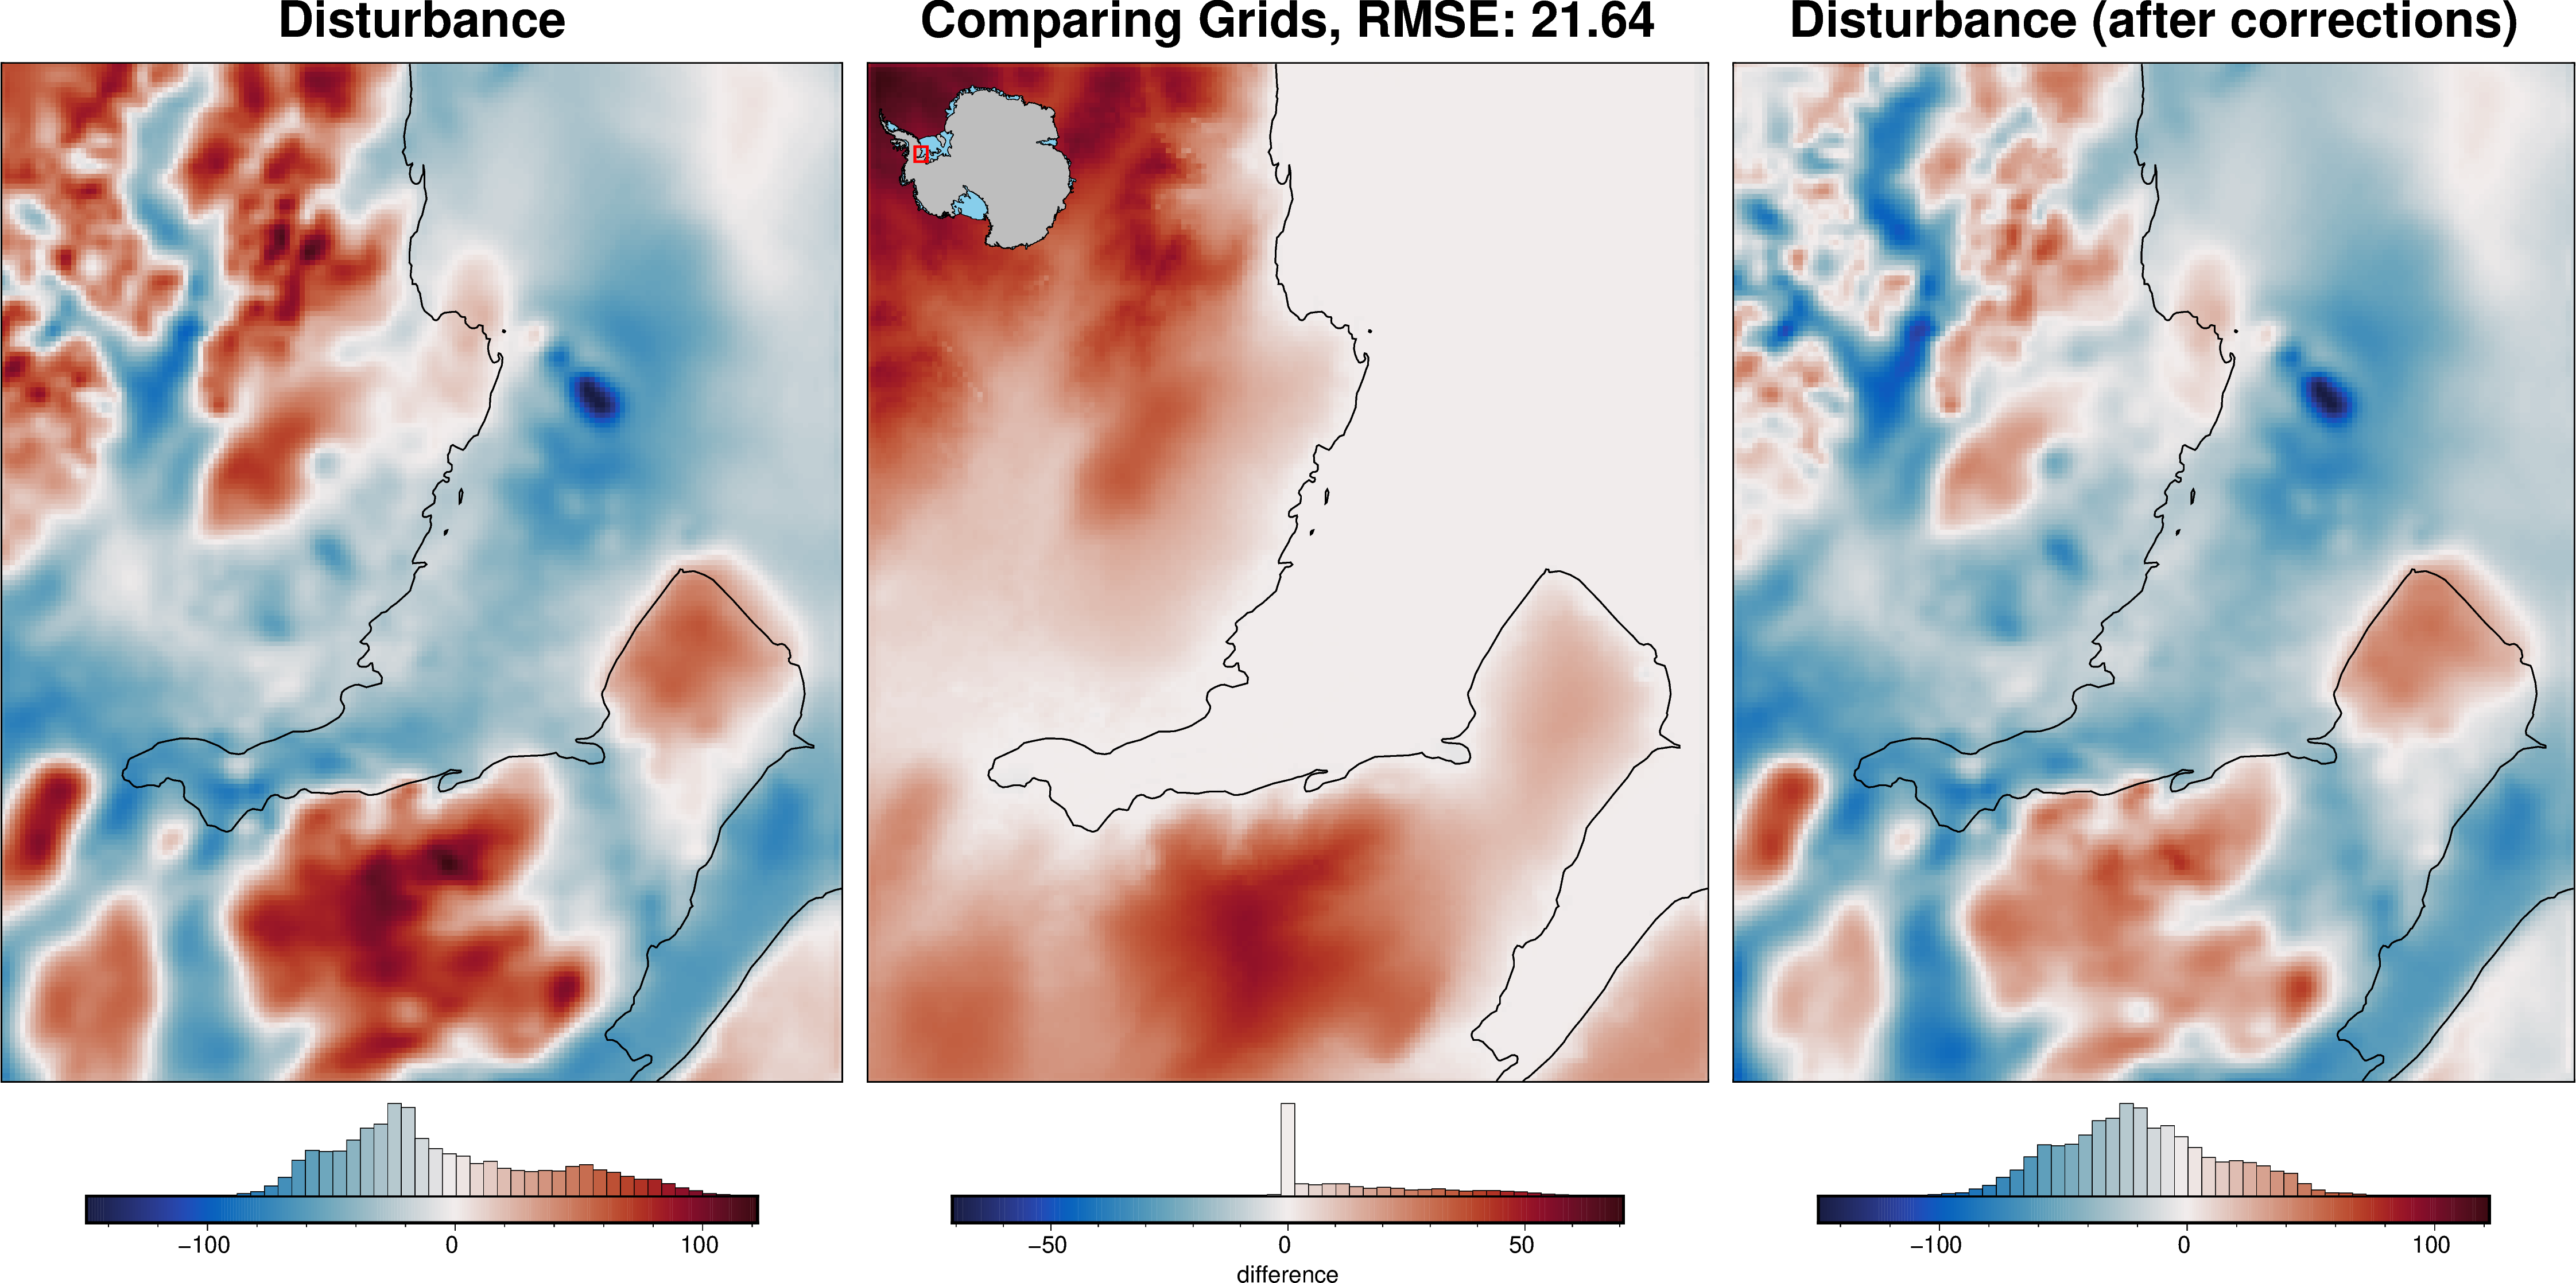
Using the forward-calculated gravity effect of the ice and water surfaces, we can remove them from the gravity disturbance. This is the input to the inversion, which Invert4Geom expects to be in a column named gravity_anomaly. If the gravity effect of the bathymetry was also removed, the resulting anomaly would be the topo-free gravity disturbance (a.k.a. the Complete Bouguer Anomaly), but since we have only corrected for the gravity effect of the water and ice density contrasts, this is a partial topo-free gravity disturbance.
[19]:
grav_data["gravity_anomaly"] = (
grav_data.gravity_disturbance - grav_data.ice_surface - grav_data.water_surface
)
_ = ptk.grid_compare(
grav_data.gravity_disturbance,
grav_data.gravity_anomaly,
cmap="balance+h0",
hist=True,
absolute=True,
coast=True,
grid1_name="Disturbance",
grid2_name="Disturbance (after corrections)",
)
ERROR 1: PROJ: proj_identify: Open of /home/mdtanker/invert4geom/.pixi/envs/default/share/proj failed
ERROR 1: PROJ: proj_identify: Open of /home/mdtanker/invert4geom/.pixi/envs/default/share/proj failed
Gravity misfit#
All inversions in Invert4Geom are based on a gravity misfit, not a gravity anomaly. This means before the inversion, we must create a starting prism model, forward model it’s gravity effect, remove it from the gravity anomaly, and get a gravity misfit.
Create starting model#
The starting bathymetry model is created following subplot g of the above diagram. We need to choose a constant density to represent the rock, and subtract the density of water (1030 kg/m3) to get a density contrast. If instead you know how rock density varies spatially, this can be included as well; see the Variable density values how-to guide.
[20]:
model = invert4geom.create_model(
zref=0,
density_contrast=2600 - 1030, # rock - water in kg/m3
topography=bed,
# upper_confining_layer=water_surface.upward,
)
model.inv.plot_model(
color_by="density",
zscale=20,
)
Forward gravity of starting prism layer#
[21]:
# calculate forward gravity of starting prism layer
grav_data.inv.forward_gravity(model, progressbar=True)
grav_data
[21]:
<xarray.Dataset> Size: 1MB
Dimensions: (northing: 201, easting: 166)
Coordinates:
* northing (northing) float64 2kB 2e+05 2.02e+05 ... 6e+05
* easting (easting) float64 1kB -1.56e+06 ... -1.23e+06
Data variables:
gravity_disturbance (northing, easting) float32 133kB -70.08 ... -15.39
upward (northing, easting) float32 133kB 838.4 860.9 ... 53.4
ice_surface (northing, easting) float64 267kB 25.49 27.46 ... 1.983
water_surface (northing, easting) float64 267kB -3.829 ... -1.811
gravity_anomaly (northing, easting) float64 267kB -91.74 ... -15.56
forward_gravity (northing, easting) float64 267kB -53.17 ... -37.85
Attributes:
region: (-1560000.0, -1230000.0, 200000.0, 600000.0)
spacing: 2000.0
buffer_width: 32000.0
inner_region: (-1528000.0, -1262000.0, 232000.0, 568000.0)
dataset_type: data
model_type: prisms
coord_names: ('easting', 'northing')Regional estimation - constraint point minimization#
Use the points where we know bathymetry to define the regional field. This is referred to as Constraint Point Minimization. The misfit is sampled at each point, then these point values are interpolated over the whole region to define the regional component of the misfit.
[22]:
# define a list of kwargs to pass to `regional_separation()`
regional_grav_kwargs = dict(
method="constraints",
constraints_df=constraints,
# grid_method="pygmt",
# tension_factor=1,
grid_method="eq_sources",
cv=True,
cv_kwargs=dict(
n_trials=20,
damping_limits=[1e-8, 10],
depth_limits=[1e3, 50e3],
plot=True,
fname="tmp/eqs_optimization",
),
block_size=spacing * 2,
constraints_block_size=spacing,
)
grav_data.inv.regional_separation(
**regional_grav_kwargs,
)
grav_data.inv.df.describe()
plotting failed with error: Mime type rendering requires nbformat>=4.2.0 but it is not installed
[22]:
| northing | easting | gravity_disturbance | upward | ice_surface | water_surface | gravity_anomaly | forward_gravity | misfit | reg | res | starting_forward_gravity | starting_misfit | starting_reg | starting_res | |
|---|---|---|---|---|---|---|---|---|---|---|---|---|---|---|---|
| count | 33366.000000 | 3.336600e+04 | 33366.000000 | 33366.000000 | 33366.000000 | 33366.000000 | 33366.000000 | 33366.000000 | 33366.000000 | 33366.000000 | 33366.000000 | 33366.000000 | 33366.000000 | 33366.000000 | 33366.000000 |
| mean | 400000.000000 | -1.395000e+06 | -5.631276 | 439.334473 | 16.173623 | -2.387643 | -19.417256 | -42.085009 | 22.667753 | 22.413242 | 0.254511 | -42.085009 | 22.667753 | 22.413242 | 0.254511 |
| std | 116047.706928 | 9.583984e+04 | 42.370014 | 403.636810 | 14.878578 | 2.674661 | 32.060988 | 41.332537 | 28.798720 | 29.305963 | 9.358645 | 41.332537 | 28.798720 | 29.305963 | 9.358645 |
| min | 200000.000000 | -1.560000e+06 | -148.937119 | -82.204796 | -2.459229 | -9.289126 | -148.749247 | -129.179081 | -123.748318 | -78.901349 | -57.644688 | -129.179081 | -123.748318 | -78.901349 | -57.644688 |
| 25% | 300000.000000 | -1.478000e+06 | -36.123276 | 82.610695 | 3.044669 | -3.722668 | -41.496856 | -73.294082 | 12.711988 | 12.324004 | -3.705189 | -73.294082 | 12.711988 | 12.324004 | -3.705189 |
| 50% | 400000.000000 | -1.395000e+06 | -16.433174 | 311.085358 | 11.340719 | -2.613375 | -21.439555 | -50.289541 | 27.843649 | 28.066433 | 0.236251 | -50.289541 | 27.843649 | 28.066433 | 0.236251 |
| 75% | 500000.000000 | -1.312000e+06 | 23.405627 | 725.451843 | 26.839440 | -1.360390 | 1.074714 | -19.183648 | 41.122556 | 40.606549 | 4.474902 | -19.183648 | 41.122556 | 40.606549 | 4.474902 |
| max | 600000.000000 | -1.230000e+06 | 122.162994 | 2054.802490 | 66.752840 | 6.171533 | 76.322404 | 85.712785 | 85.068466 | 86.849162 | 56.955387 | 85.712785 | 85.068466 | 86.849162 | 56.955387 |
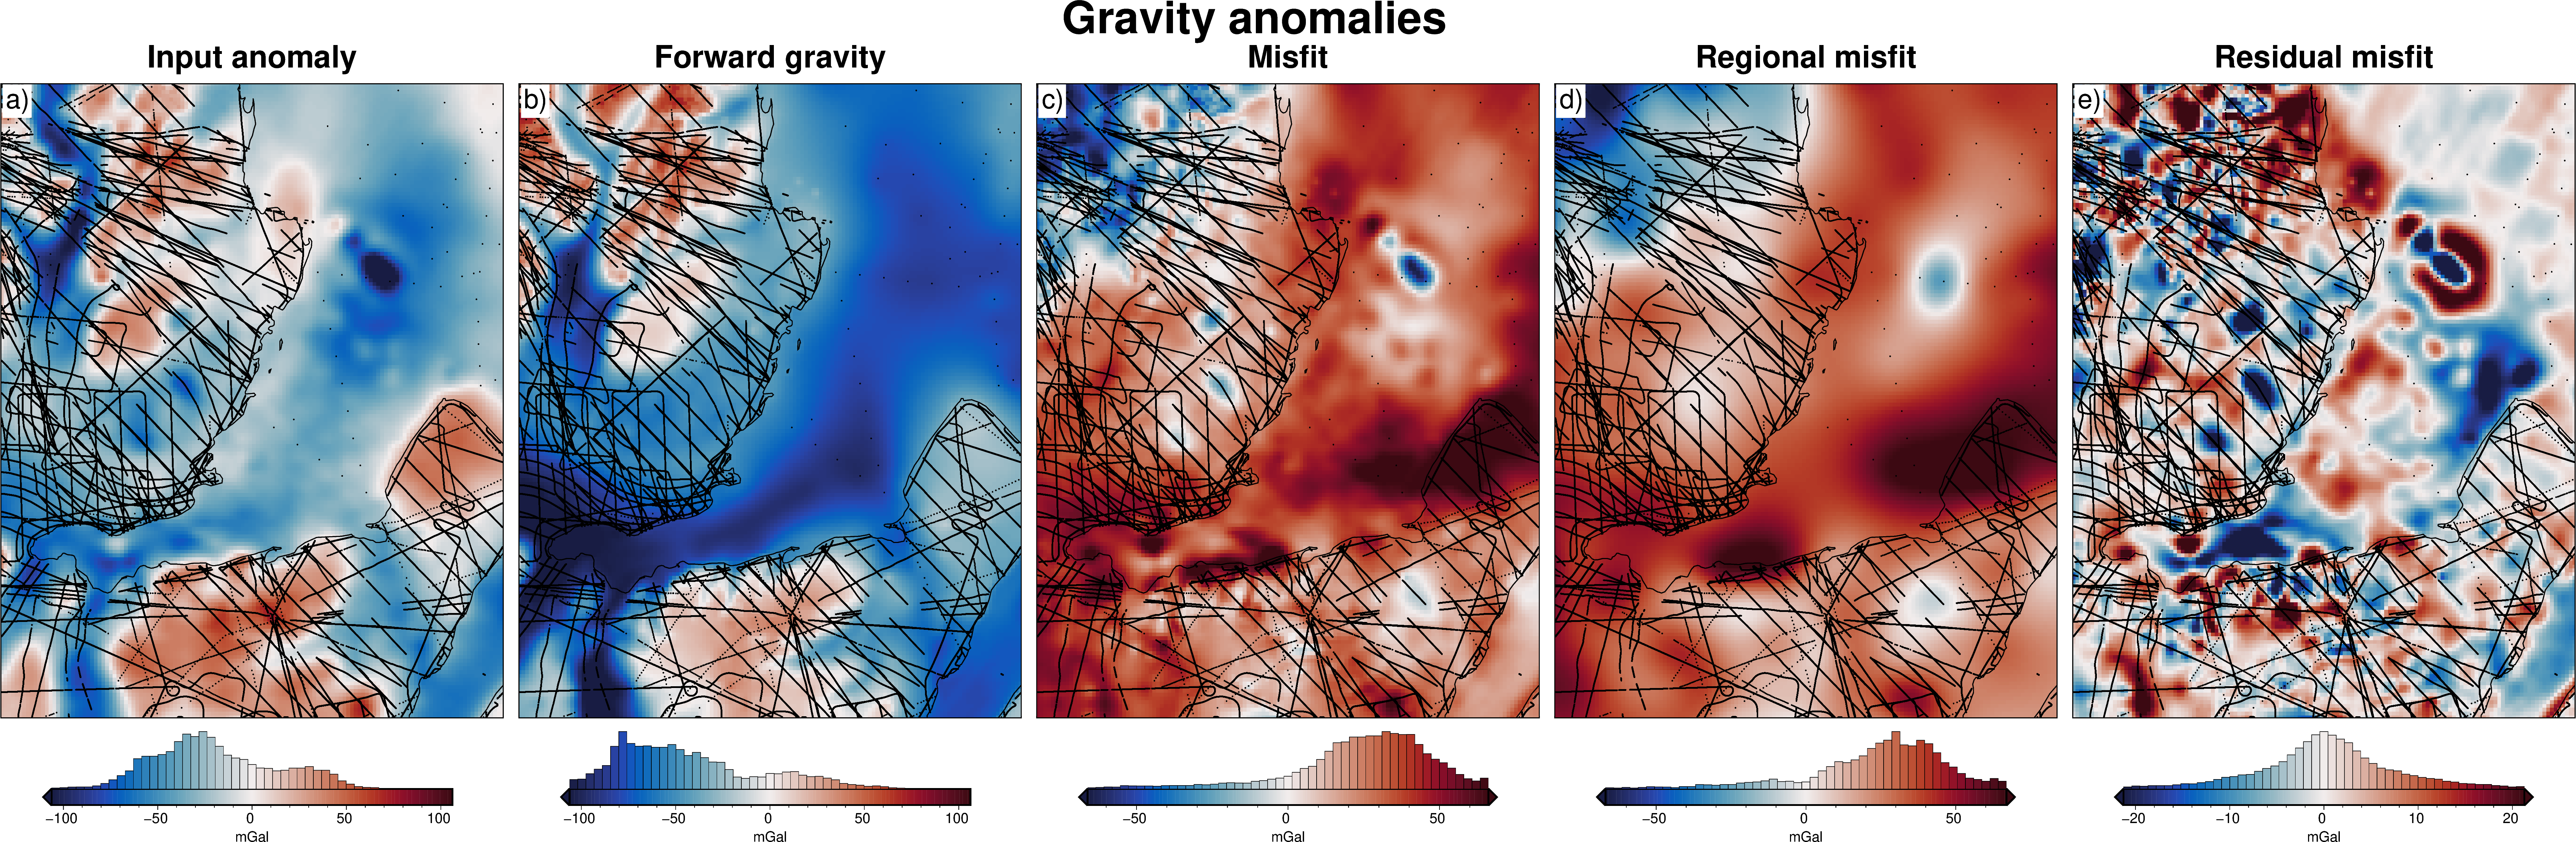
[23]:
grav_data.inv.plot_anomalies(
points=constraints,
points_style="p1p",
coast=True,
)
Single inversion#
Perform a single inversion with manually set values of stopping criteria and damping.
[24]:
# setup the inversion
inv = invert4geom.Inversion(
grav_data,
model,
solver_damping=0.05,
# set stopping criteria
max_iterations=30,
l2_norm_tolerance=1.5, # stop if L2-norm < 1.5 mGal (RMSE of 2.25 mGal)
delta_l2_norm_tolerance=1.01, # stop if iteration's change in L2-norm < 1%
)
[25]:
# run the inversion
inv.invert(
plot_dynamic_convergence=True,
results_fname="../tmp/ice_shelf_model",
)
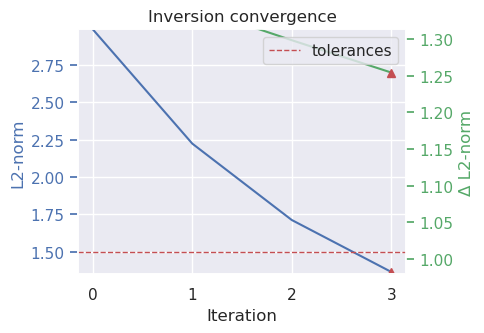
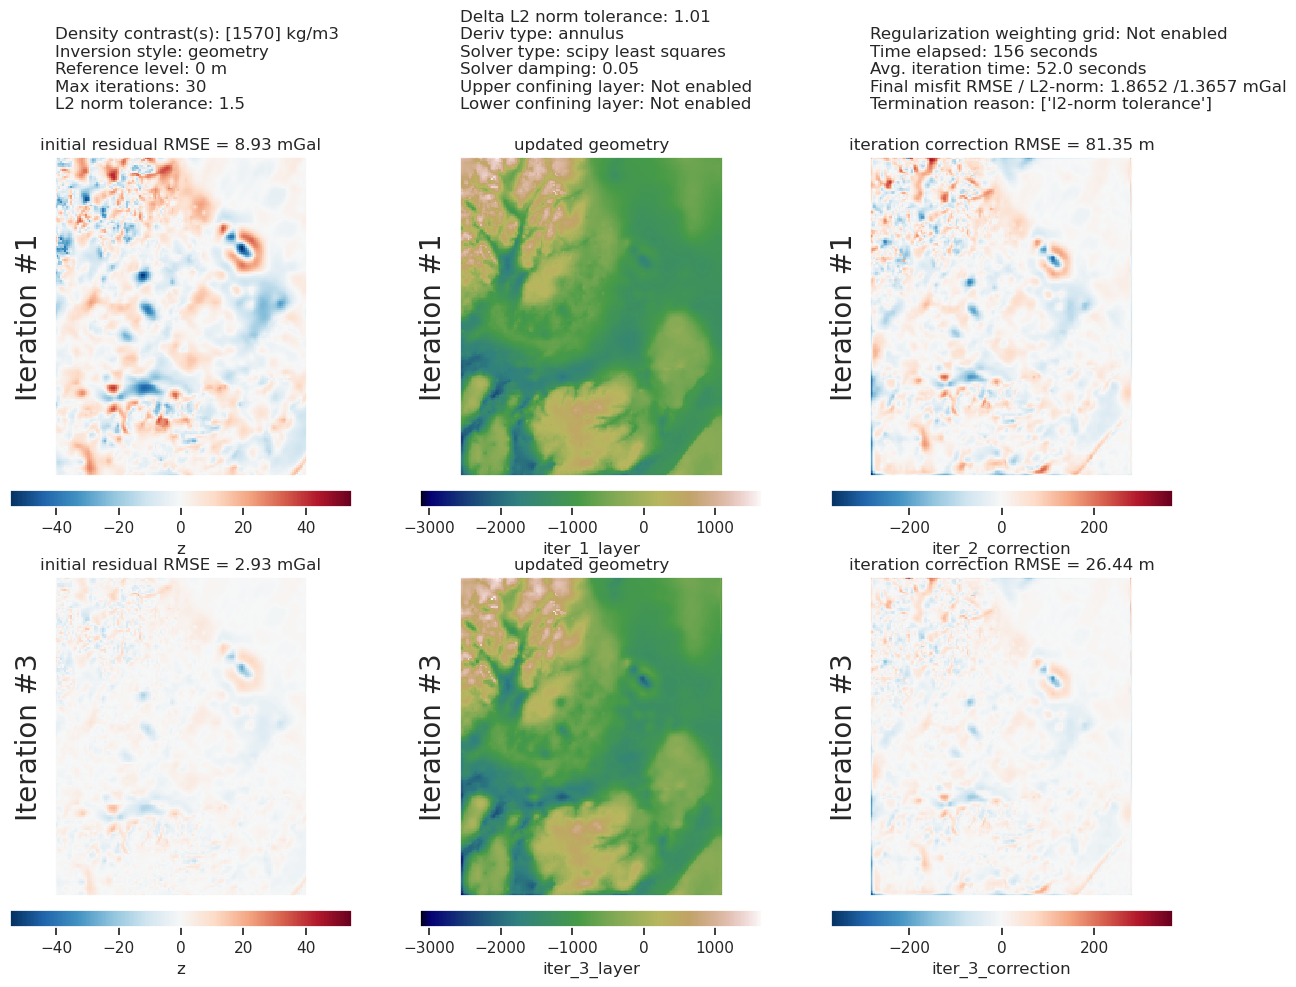
[26]:
inv.stats_df
[26]:
| iteration | rmse | l2_norm | delta_l2_norm | iter_time_sec | |
|---|---|---|---|---|---|
| 0 | 0.0 | 8.929902 | 2.988294 | inf | NaN |
| 1 | 1.0 | 4.946177 | 2.224000 | 1.343657 | 112.804204 |
| 2 | 2.0 | 2.934344 | 1.712993 | 1.298313 | 170.146890 |
| 3 | 3.0 | 1.865231 | 1.365735 | 1.254265 | 57.040488 |
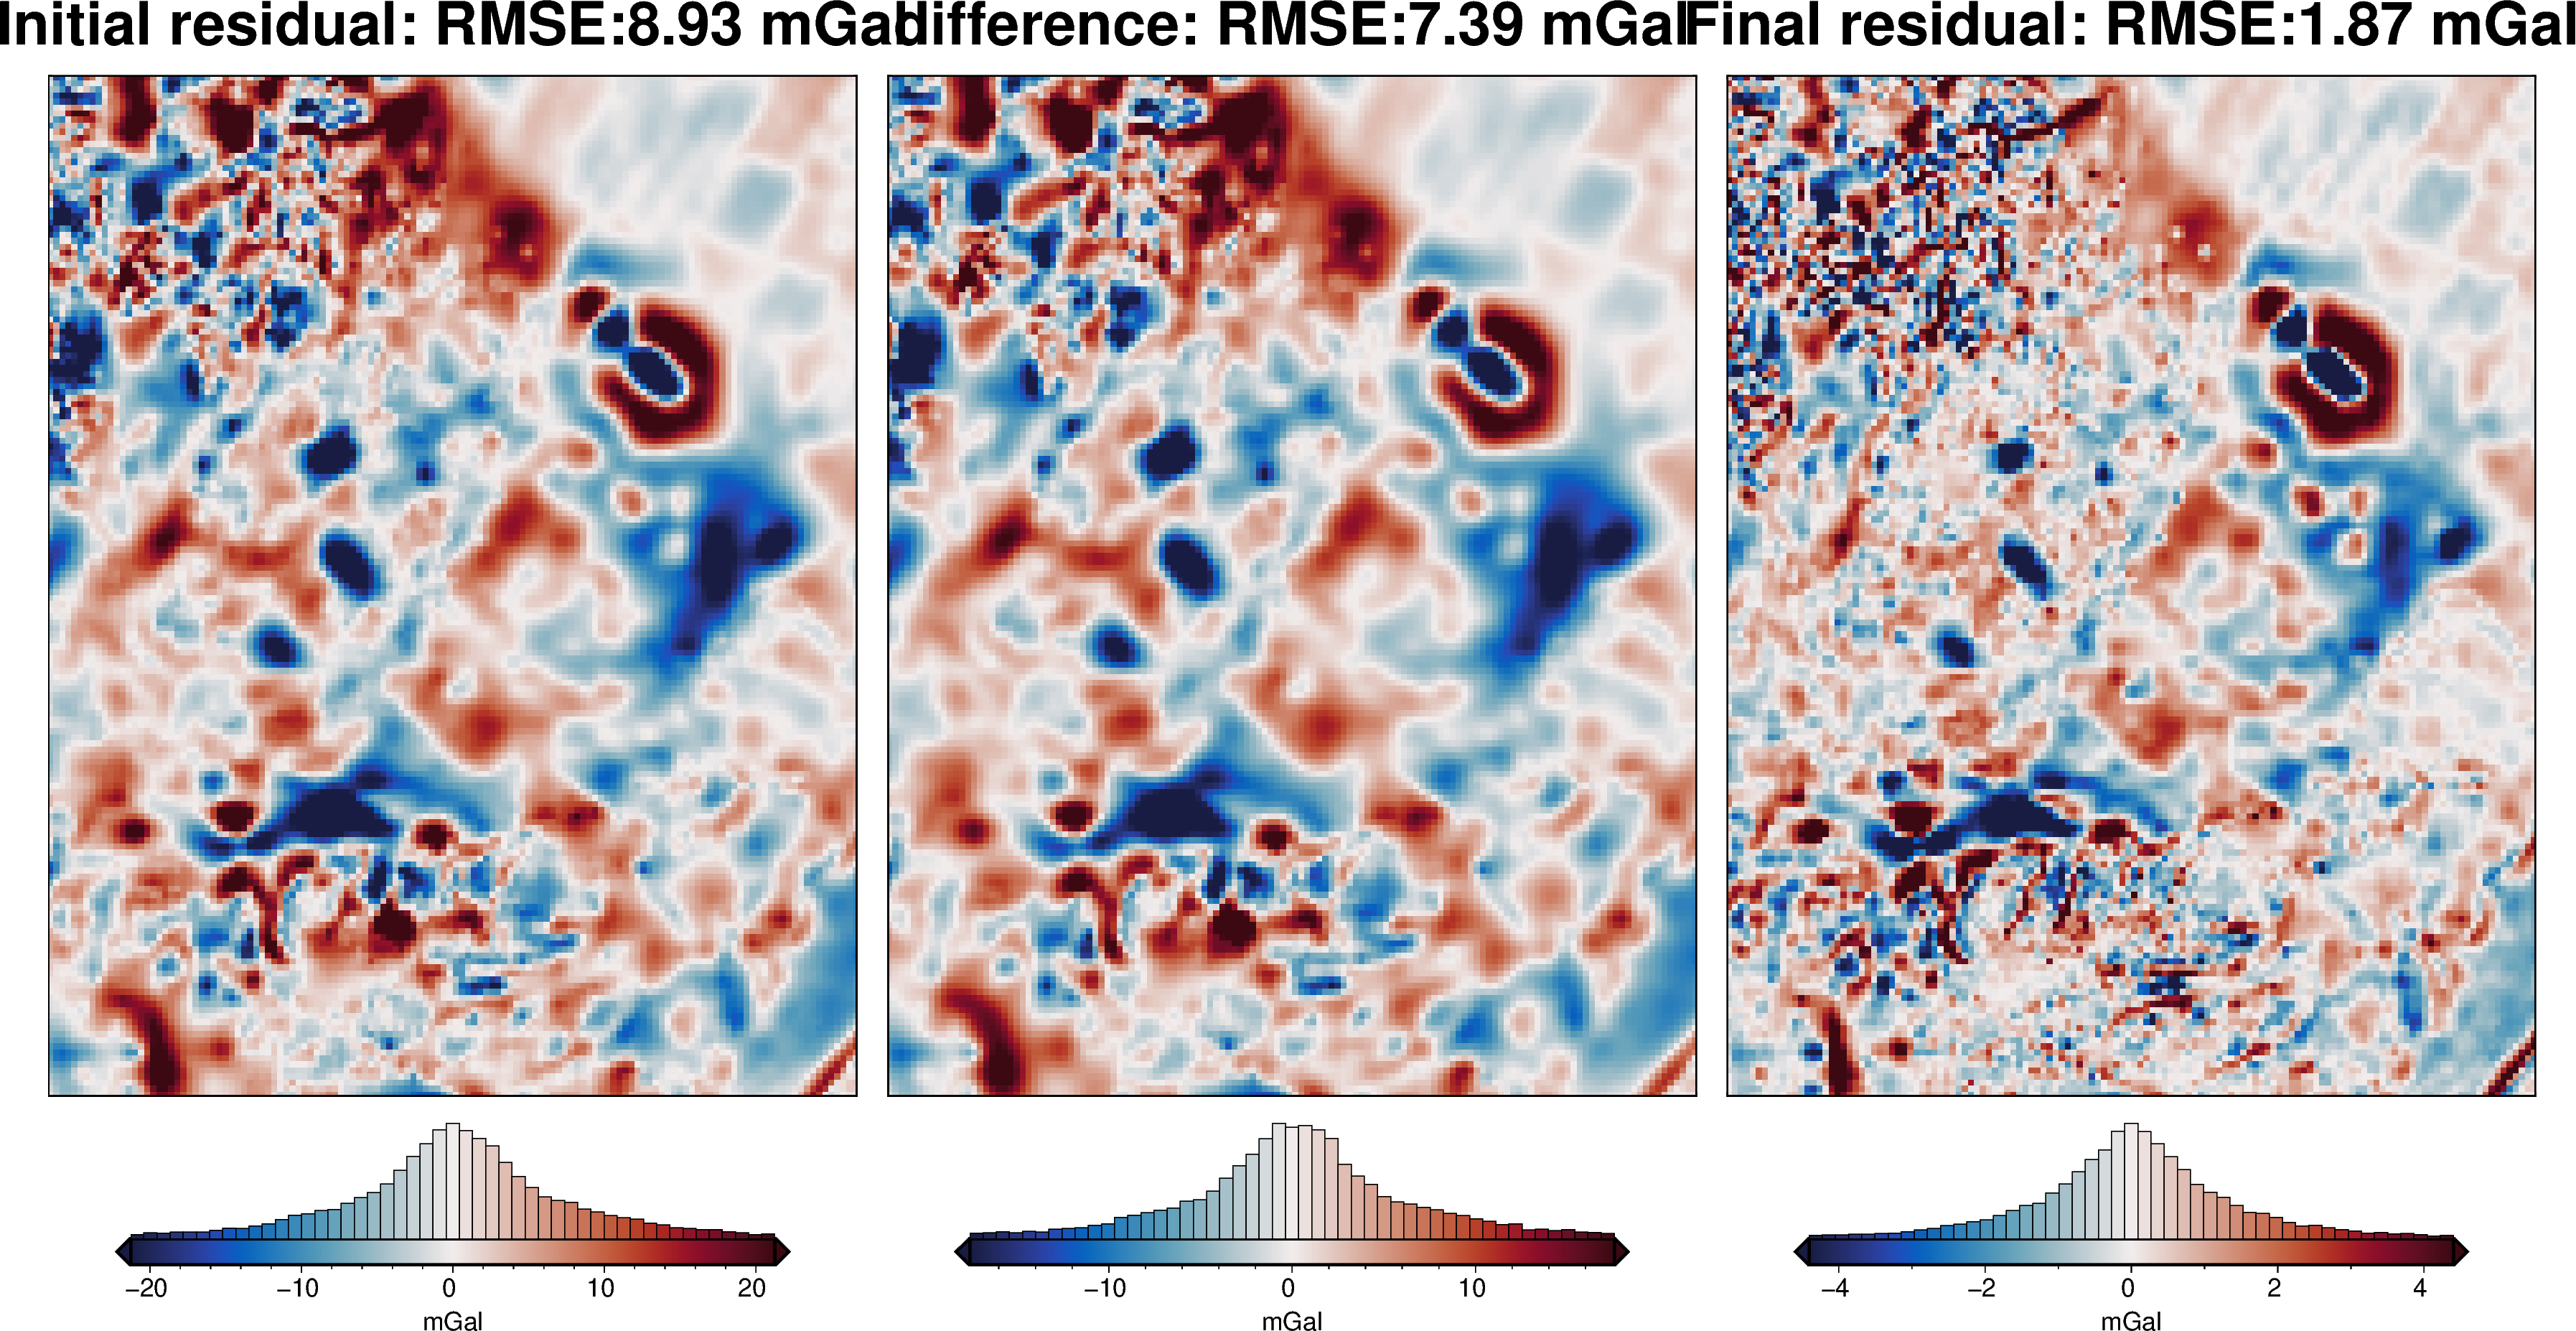
[27]:
inv.plot_inversion_results(
iters_to_plot=2,
)
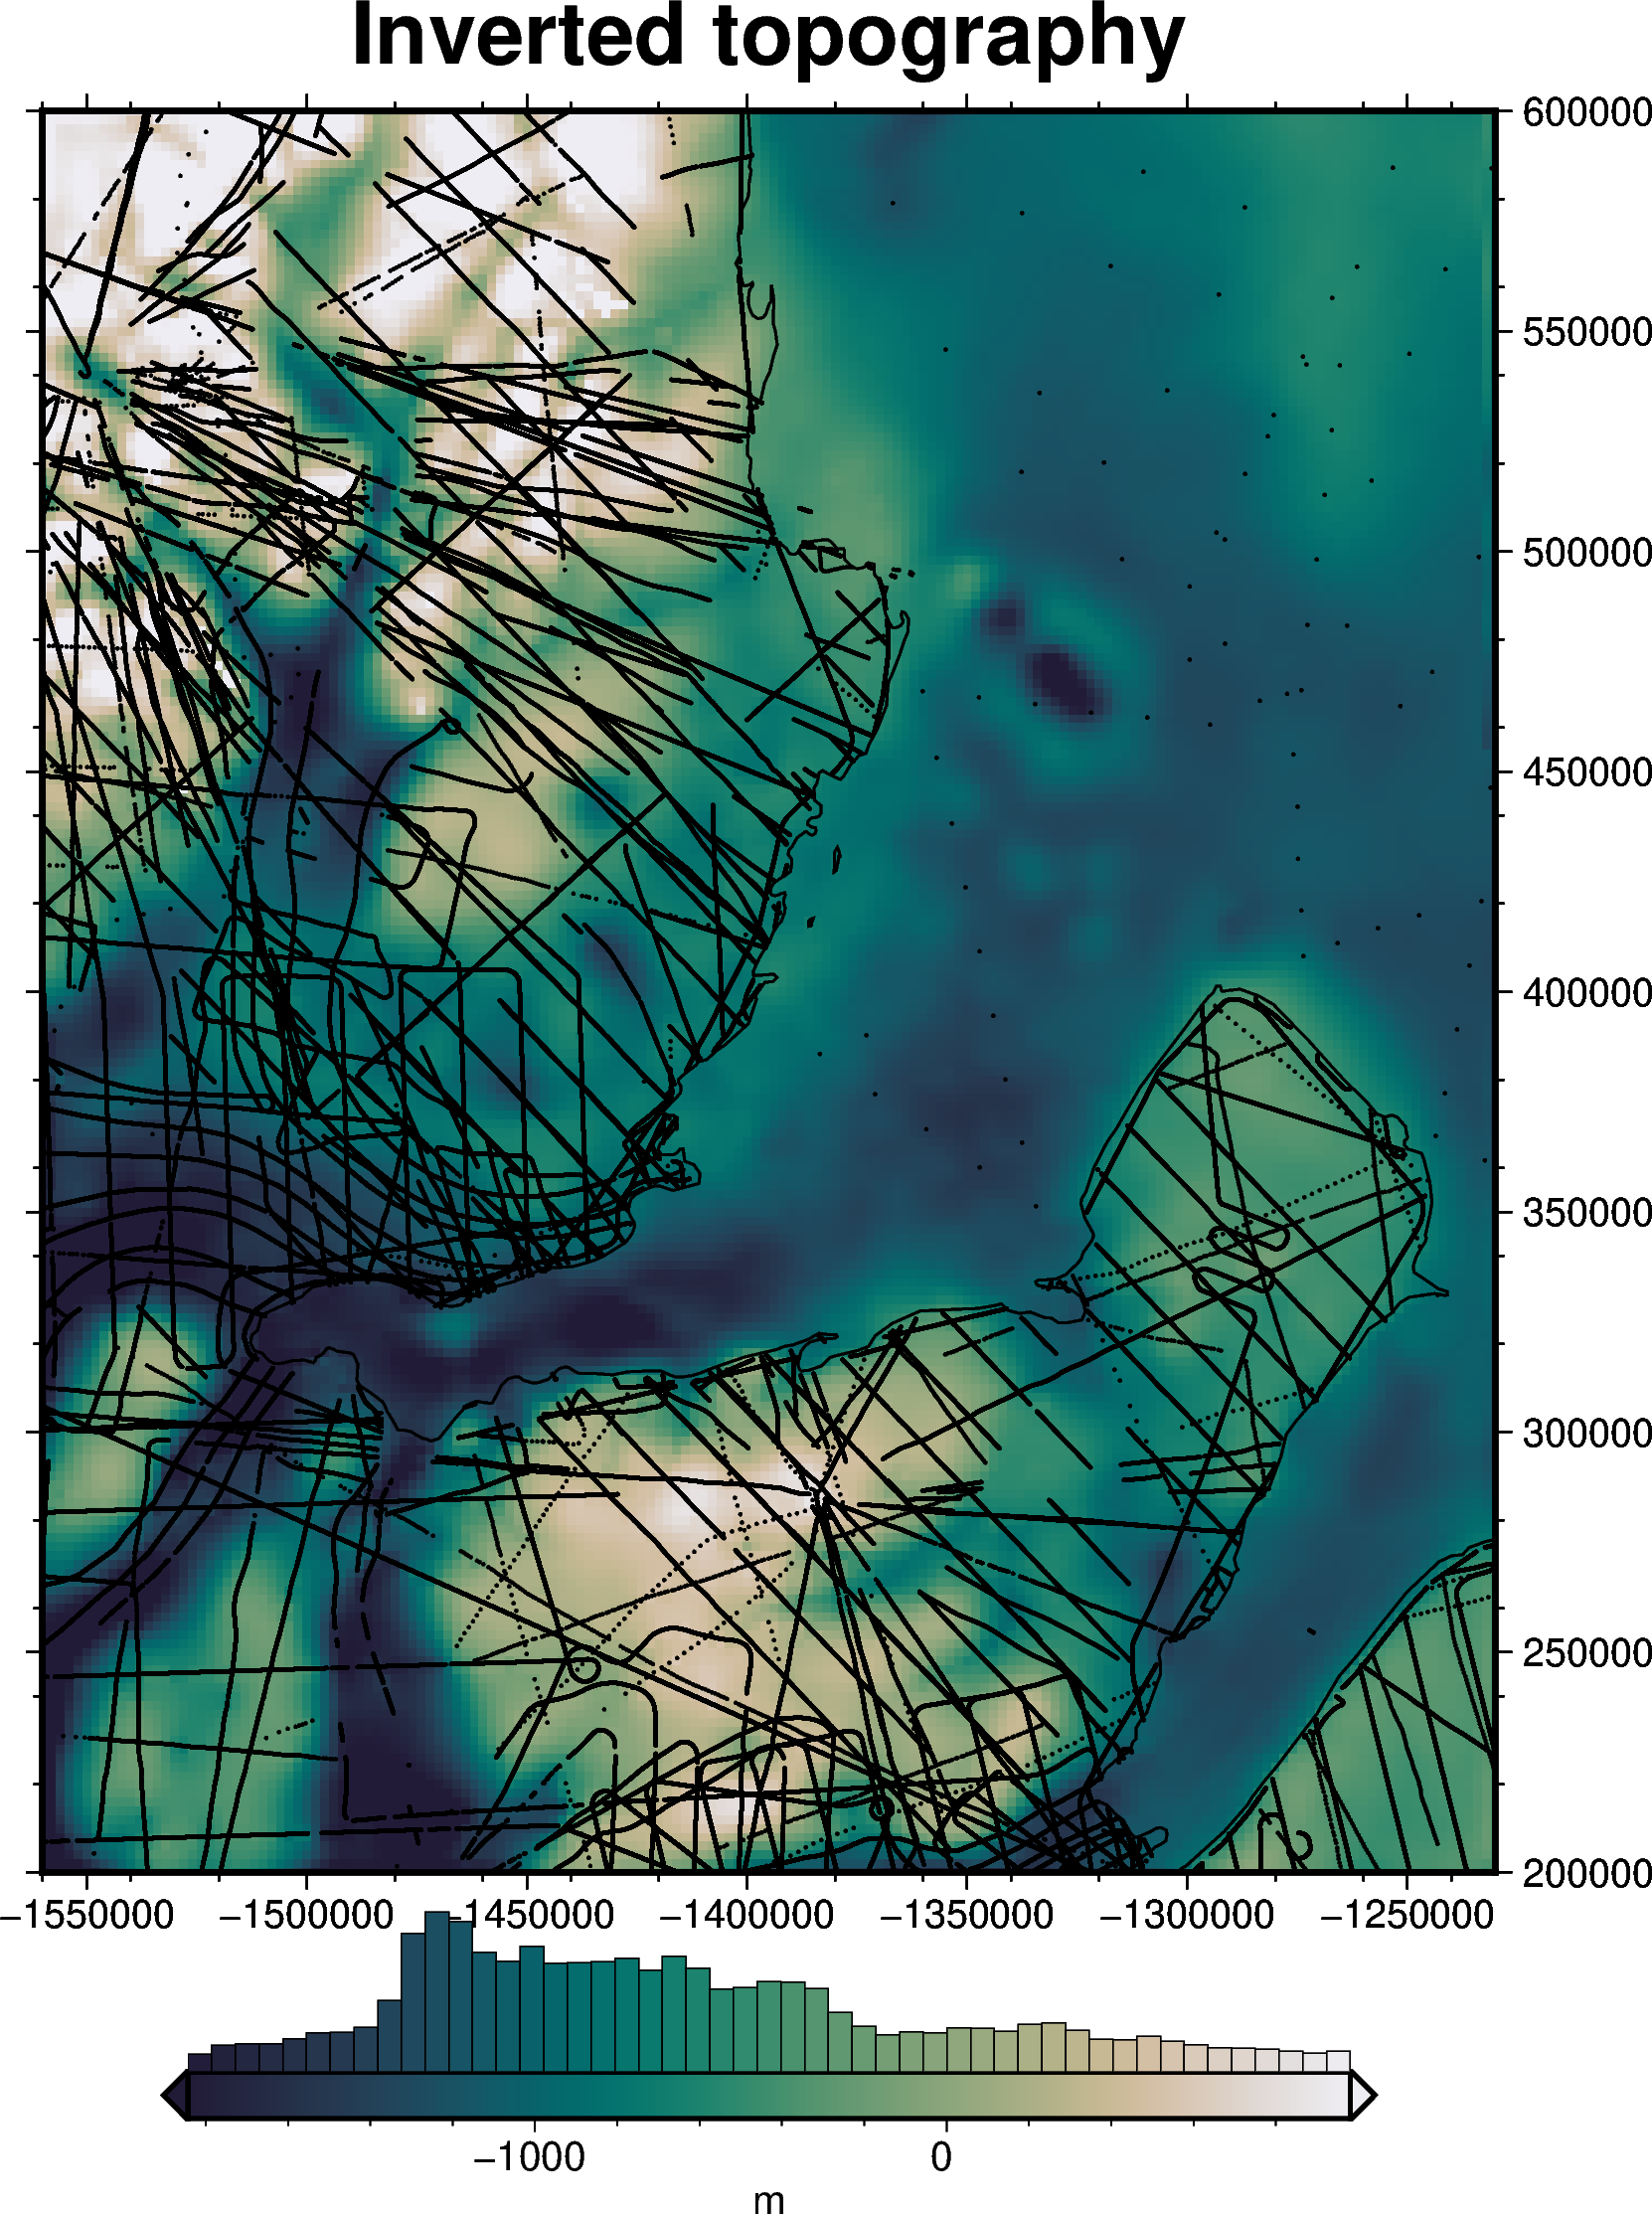
[28]:
fig = ptk.plot_grid(
inv.model.inv.inner.topography,
title="Inverted topography",
cmap="rain",
reverse_cpt=True,
cbar_label="m",
hist=True,
frame=["nSwE", "xaf20000", "yaf20000"],
coast=True,
robust=True,
points=constraints,
points_style="p1p",
)
fig.show()
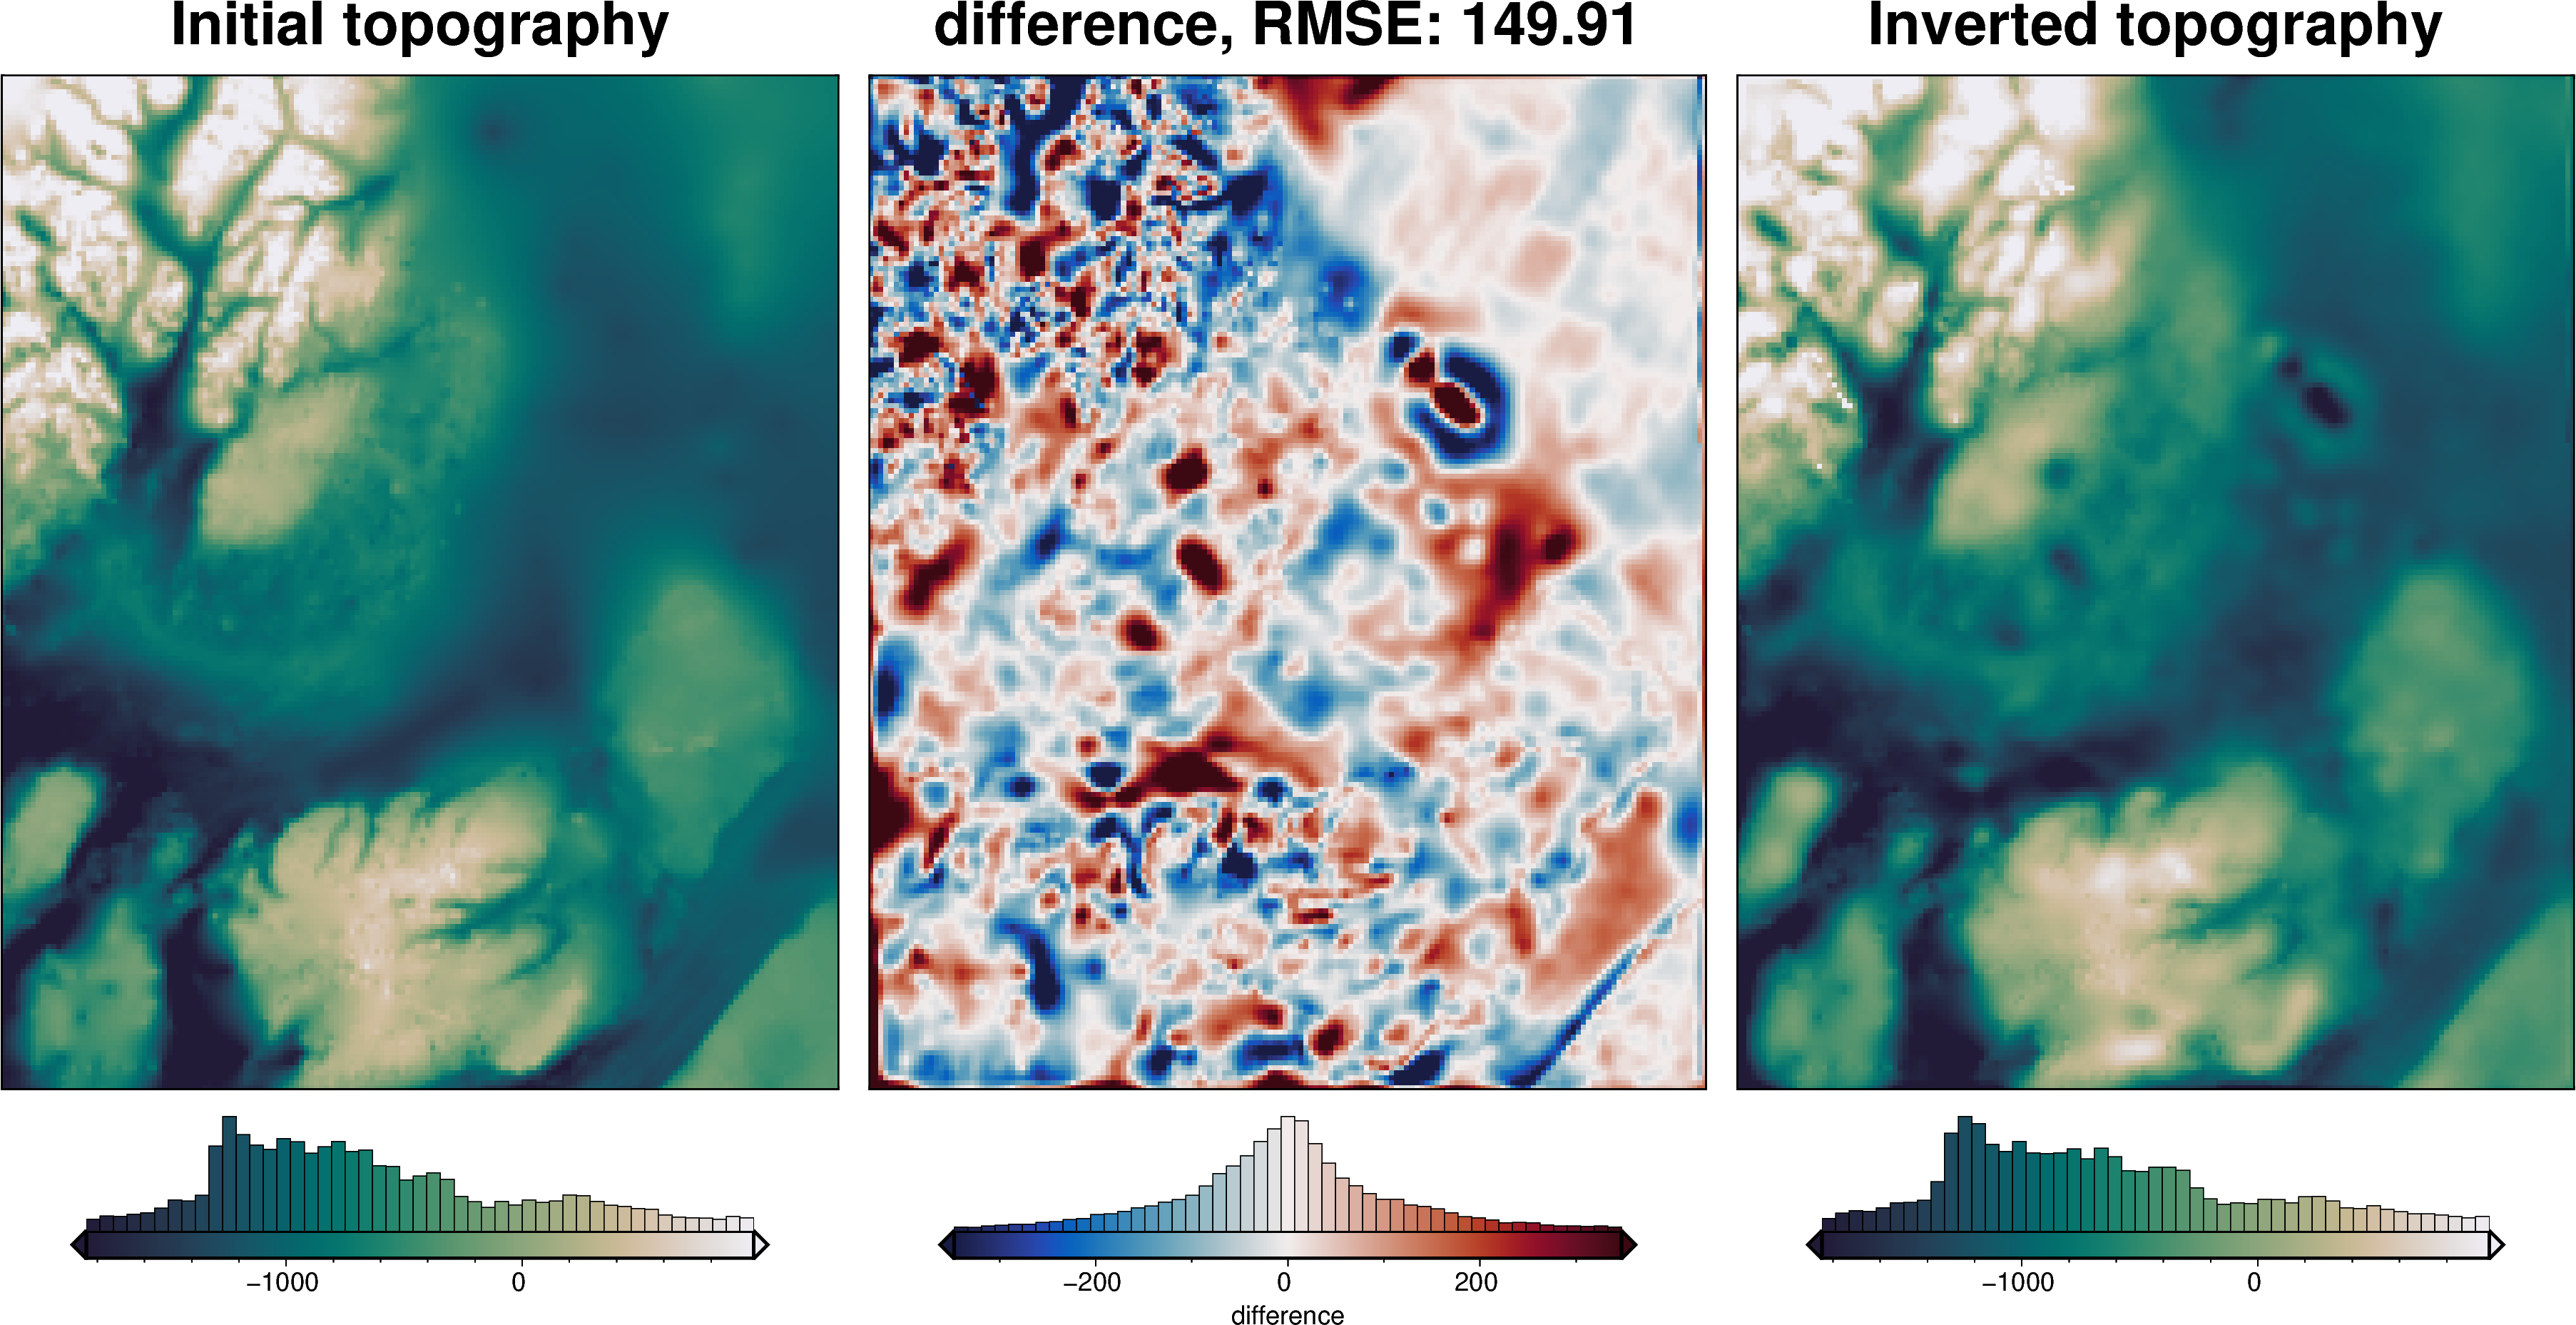
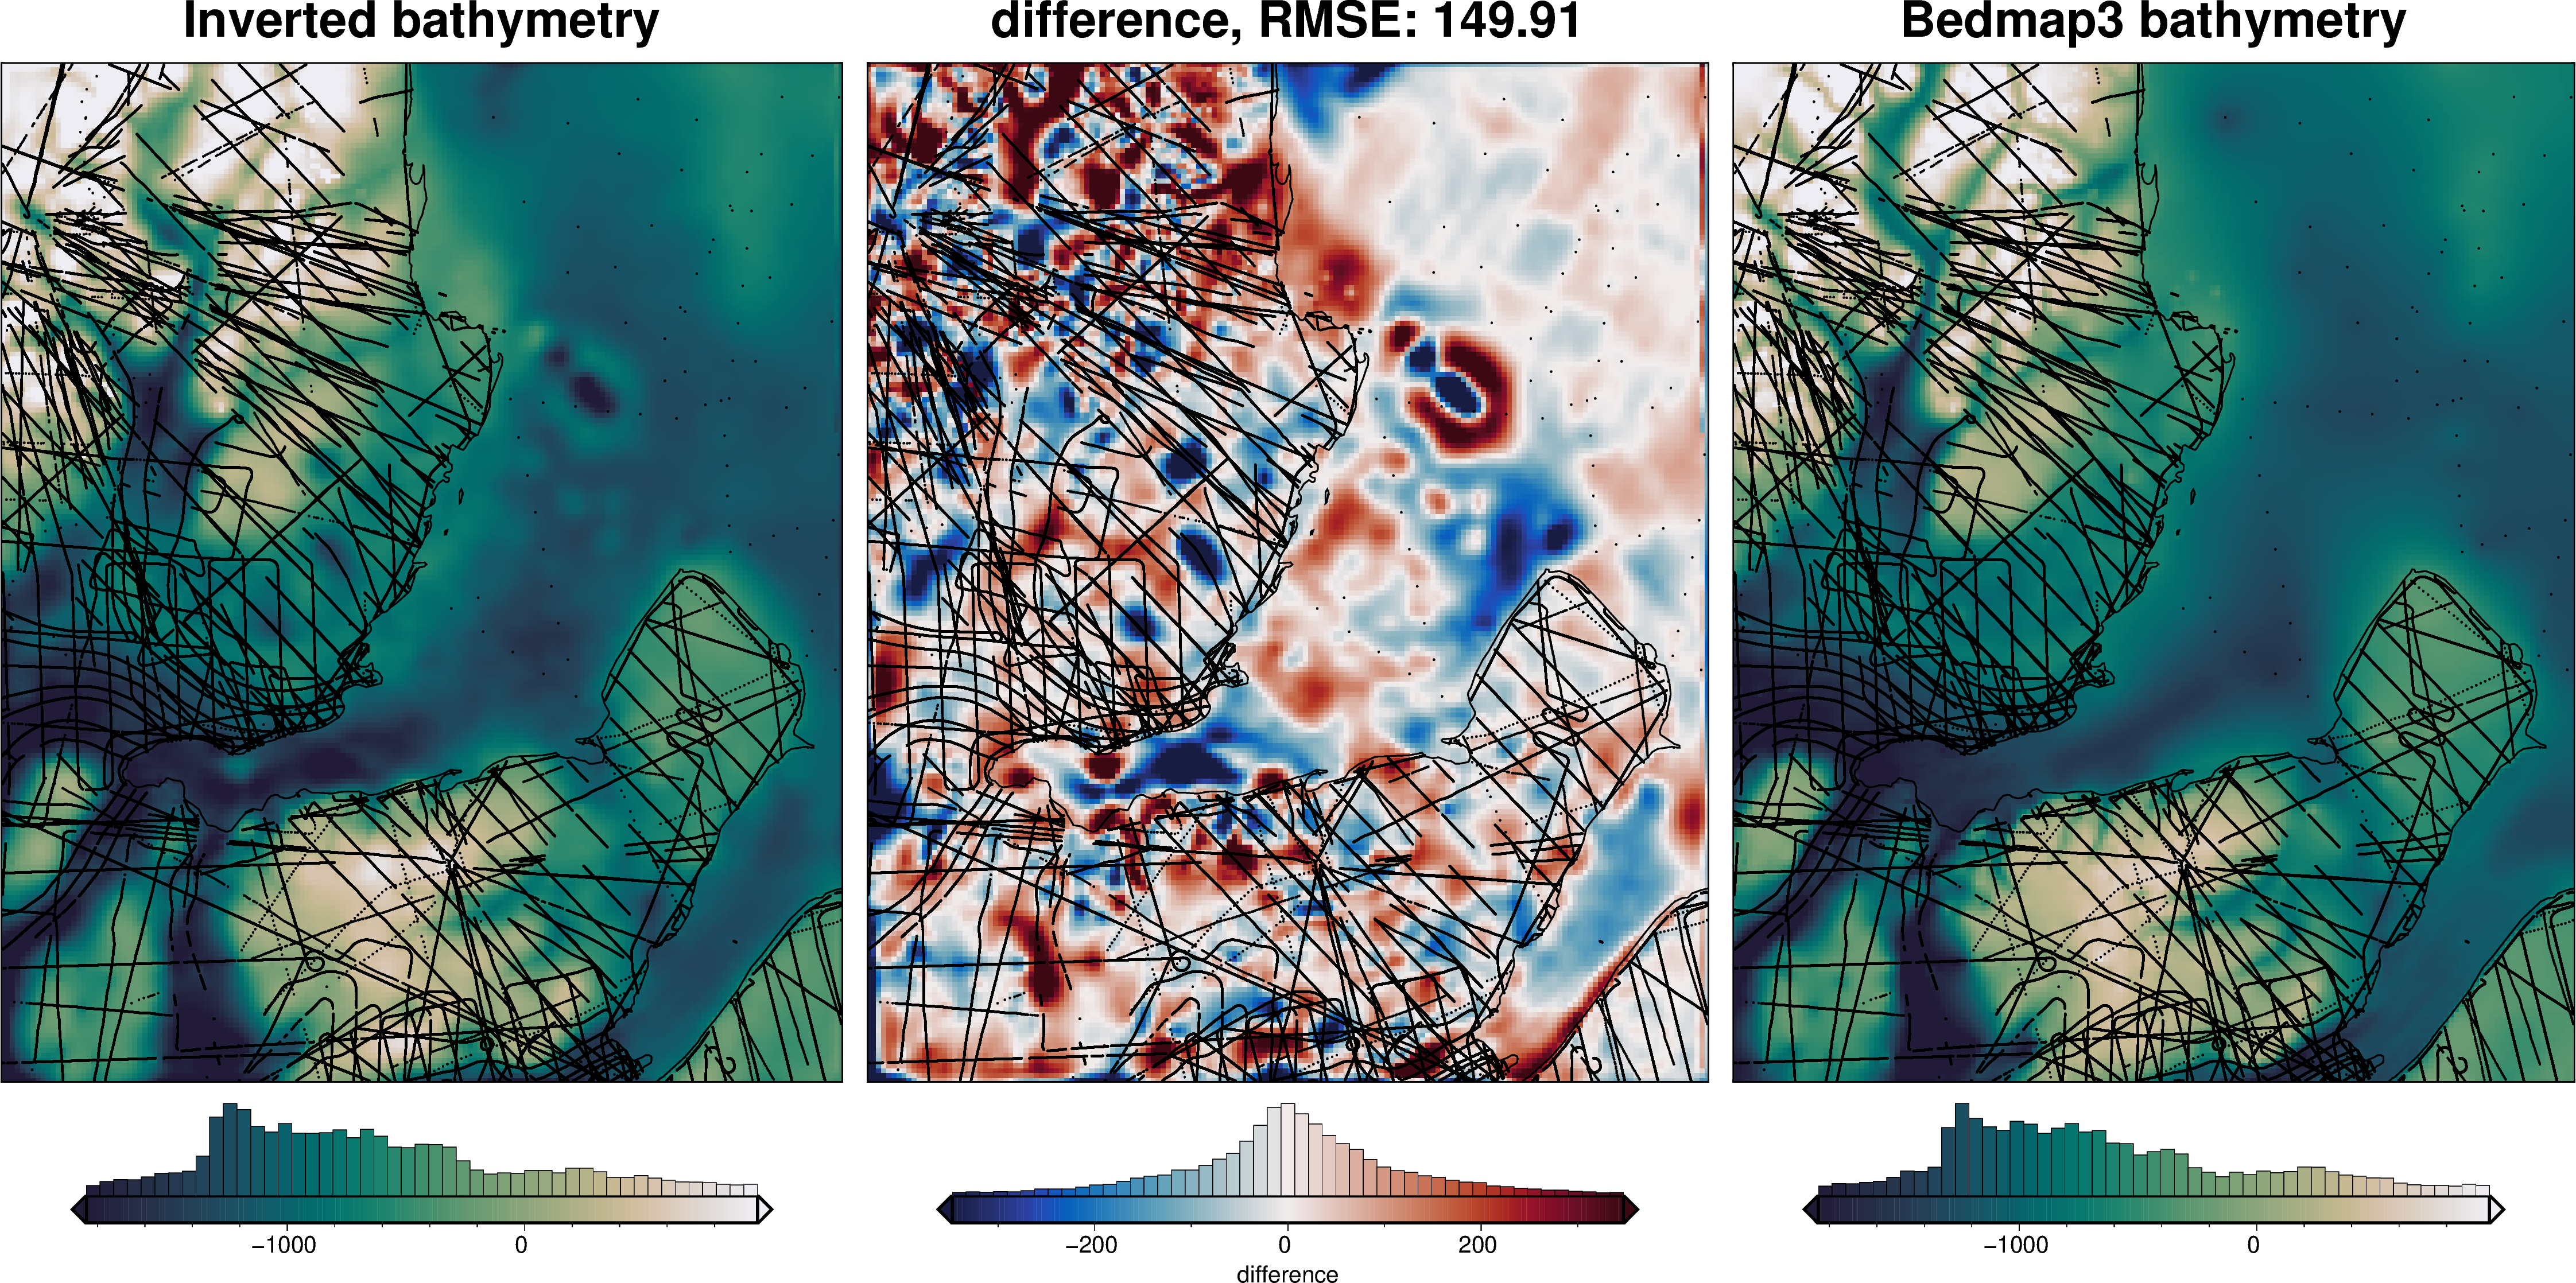
[29]:
_ = ptk.grid_compare(
inv.model.inv.inner.topography,
bedmap_bed.upward,
grid1_name="Inverted bathymetry",
grid2_name="Bedmap3 bathymetry",
robust=True,
hist=True,
inset=False,
verbose="q",
title="difference",
reverse_cpt=True,
cmap="rain",
points=constraints,
points_style="p1p",
coast=True,
)
[ ]: